Gold Prices Steady Amid Tariff Threats – Will $2,922 Support Hold?

Gold prices remained steady on Friday, poised for an eighth consecutive weekly gain amid ongoing concerns over U.S. President Donald Trump’s tariff threats.

Spot gold traded at $2,930, while U.S. gold futures held firm at $2,956.10. The market’s cautious optimism stems from safe-haven inflows as investors hedge against potential geopolitical and economic volatility.
| Broker | Review | Regulators | Min Deposit | Website | |
|---|---|---|---|---|---|
| 🥇 |  | Read Review | FCA, CySEC, ASIC, MAS, FSA, EFSA, DFSA, CFTC | USD 100 | Visit Broker |
| 🥈 | Read Review | FSCA, FSC, ASIC, CySEC, DFSA | USD 5 | Visit Broker | |
| 🥉 |  | Read Review | CySEC, MISA, FSCA | USD 25 | Visit Broker |
| 4 |  | Read Review | ASIC, BaFin, CMA, CySEC, DFSA, FCA, SCB | USD 200 | Visit Broker |
| 5 |  | Read Review | ASIC, FCA, CySEC, SCB | USD 100 | Visit Broker |
| 6 | Read Review | FCA, FSCA, FSC, CMA | USD 200 | Visit Broker | |
| 7 | Read Review | BVI FSC | USD 1 | Visit Broker | |
| 8 |  | Read Review | CBCS, CySEC, FCA, FSA, FSC, FSCA, CMA | USD 10 | Visit Broker |
| 9 |  | Read Review | ASIC, CySEC, FSCA, CMA | USD 100 | Visit Broker |
| 10 |  | Read Review | IFSC, FSCA, ASIC, CySEC | USD 1 | Visit Broker |
Earlier this week, Trump announced plans for new tariffs, adding lumber and forest products to an already extensive list that includes imported cars, semiconductors, and pharmaceuticals. This escalation has heightened fears of a trade war, which historically boosts demand for gold as a safe-haven asset.
According to Brian Lan, Managing Director at GoldSilver Central, “Uncertainties are still there, and gold seems strong at the moment, but we might see a pullback in the near term.” His caution reflects the market’s delicate balance as it navigates geopolitical risks and economic data releases.
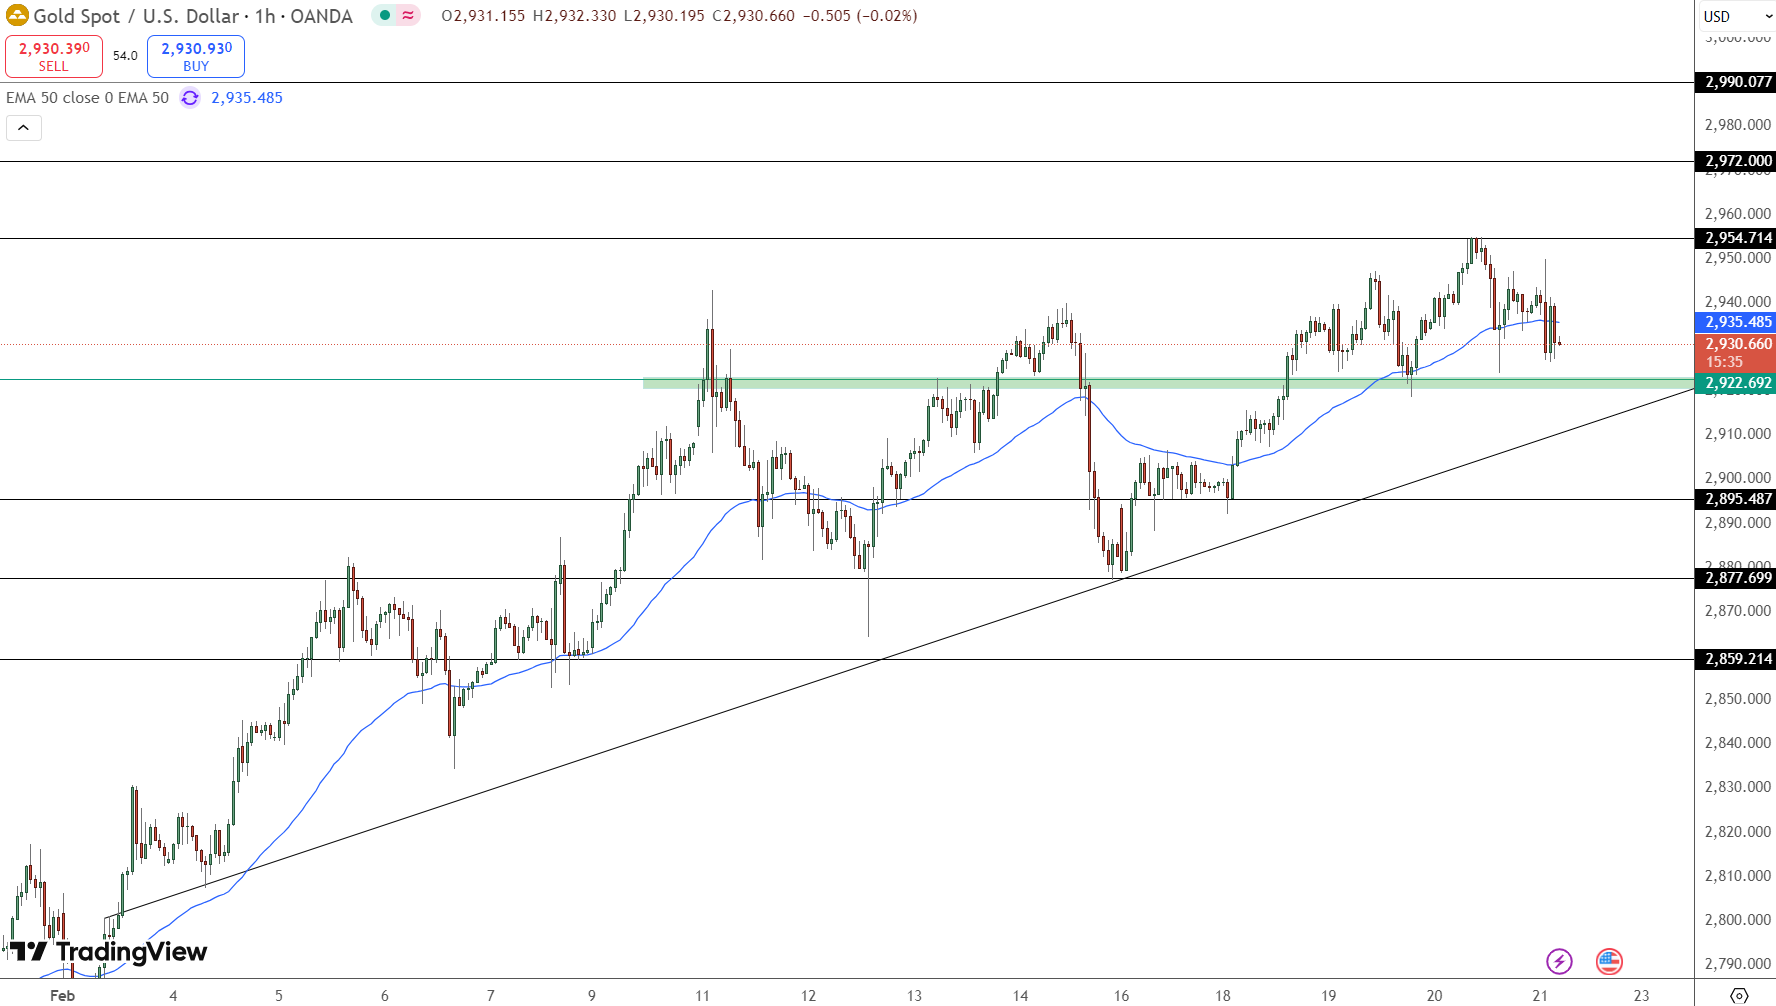
Gold Technical Analysis: Key Support at $2,922
The Gold Spot (XAU/USD) 1-hour chart indicates a potential bearish breakdown as prices test the crucial support level at $2,922. The price is currently hovering around $2,930, just below the 50-period EMA at $2,935, which acts as dynamic resistance.
Key technical levels to watch:
Support Levels:
$2,922: Immediate support. A break below this could trigger further selling pressure.
$2,895: Secondary support level.
$2,877: Stronger floor, which could lead to accelerated bearish momentum if breached.
Resistance Levels:
$2,954: Immediate resistance.
$2,972: Stronger barrier; a breakout above this level could reignite bullish momentum.
$2,990: Psychological level, signaling continued upward momentum.
If the price holds above $2,922 and breaks back above the 50 EMA, a bullish reversal could be on the horizon. However, a decisive break below $2,922 could invalidate this scenario, paving the way for further downside.
Geopolitical Risks and Fed Policy Influence Outlook
Geopolitical tensions and U.S. Federal Reserve policies continue to shape the gold market outlook. The Fed is closely monitoring rising inflationary risks and the potential economic impact of Trump’s trade and immigration policies. Fed Governor Adriana Kugler remarked, “I consider it appropriate to hold the federal funds rate in place for some time, given the balance of risks that we face right now.”
Gold is traditionally seen as a hedge against geopolitical risks and inflation. However, higher interest rates could dampen its appeal as a non-yielding asset. Traders should keep a close watch on upcoming U.S. economic data releases and Fed policy statements, as they are likely to impact market sentiment and influence gold price movements.
Meanwhile, Swiss gold exports surged year-on-year in January, with supplies to the U.S. hitting the highest levels in at least 13 years. This trend underscores the strong demand for gold as a safe-haven asset amidst global uncertainty.
Market Outlook: Key Takeaways for Traders
Monitor the $2,922 support level closely. A break below could accelerate bearish momentum toward $2,895 and $2,877.
A breakout above $2,954 and $2,972 would challenge the bearish outlook, potentially leading to a bullish reversal toward $2,990.
Keep an eye on upcoming U.S. tariff announcements, economic data releases, and Fed policy updates for potential market-moving events.
Geopolitical developments, especially related to U.S.-China trade tensions, will continue to influence safe-haven demand for gold.


Add 3442

Related Posts
Add 3440