Forex Signals Brief Feb 21: Weak Manufacturing PMI Could Weaken USD Further, Boost Gold Prices
The USD Tumbled 1 cent lower yesterday while Gold printed a new high, so a softer PMI manufacturing read would amplify the moves today.

Live BTC/USD Chart

The USD tumbled 1 cent lower yesterday while Gold printed a new high, so a softer PMI manufacturing read would amplify the moves today.

Yesterday started with the Australian Bureau of Statistics’ latest Labor Force report, which revealed a 44,000-job increase, surpassing the 20,000 expected but falling short of the previous month’s 56,300 gain. The participation rate climbed to a record 67.3%, exceeding the 67.1% from the prior report. This contributed to a slight uptick in the unemployment rate from 4.0% to 4.1%, driven in part by higher female workforce participation.
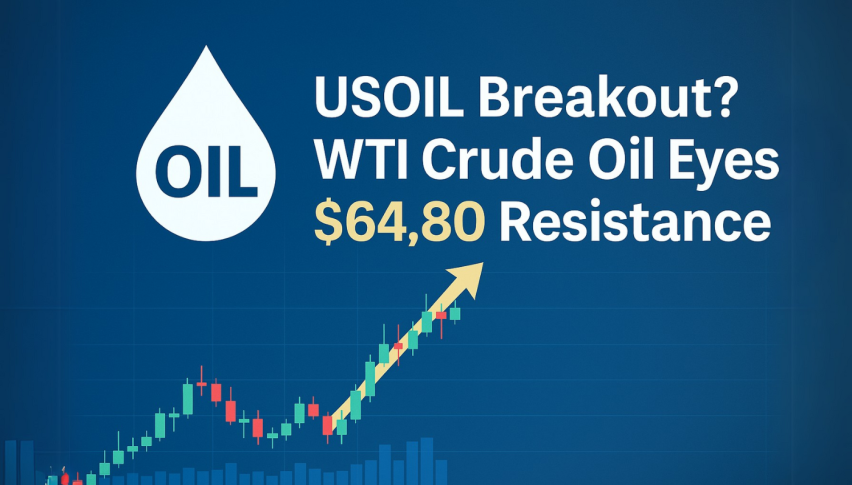
Crude Oil prices continued to climb as WTI moved above $73 on trump’s comments for refilling the SPR reserve, which showed higher EIA crude inventories. But then Oil lost most of the gains, ending the day at $72 lows.
The U.S. dollar weakened against all major currencies, with the USD/JPY hitting a new yearly low at 149, its lowest level since December. Throughout the day, several Federal Reserve officials—including Bostic, Musalem, and Goolsbee—delivered speeches. While Bostic still anticipated two rate cuts before the end of the year, the overall tone remained cautious. This sentiment contributed to further USD declines toward the end of the U.S. trading session. Meanwhile, U.S. stock markets opened lower and remained in negative territory throughout the day. In contrast, Bitcoin saw strong gains, rising to $98,758, its highest level since February 14.
Today’s Market Expectations
Global markets remain in a state of flux, with investors closely watching economic data releases, geopolitical tensions, and monetary policy shifts. European indices showed mixed performance, with some resilience in France and Spain, while Germany, the UK, and Italy faced declines. In Australia, a strong labor market and record workforce participation highlight economic stability, despite a minor uptick in unemployment. Gold’s rally continues, driven by global economic uncertainty, while Bitcoin and Ethereum navigate heightened volatility amid shifting investor sentiment. As markets await upcoming PMI data and interest rate signals, the next phase of movement in equities, commodities, and crypto will depend on broader macroeconomic developments.
Yesterday the volatility picked up in forex as the US dollar resumed the decline, losing the gains that it made all week, and catching some traders on the wrong side. US stock markets turned a slightly bearish, also triggering some weak stops in main stock markets and indices.
MAs Keeping Gold Supported On the Way to $3,000
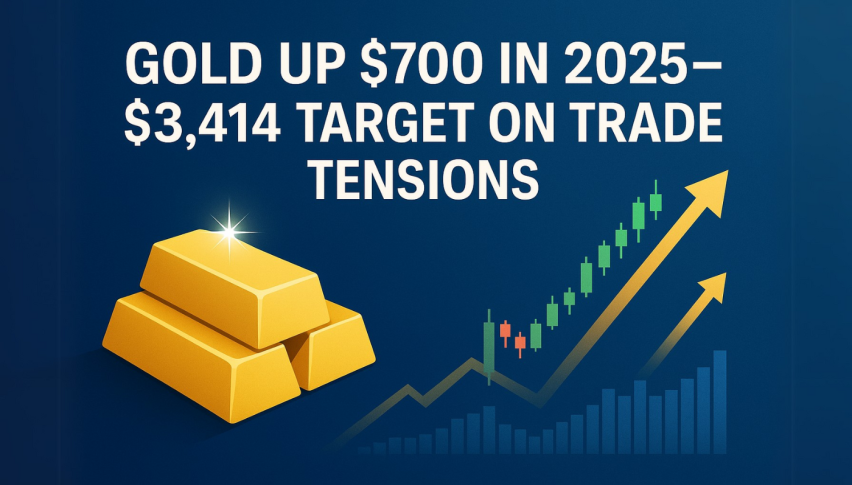
The safe-haven appeal of gold remains strong as financial market volatility continues to drive demand. Gold surged to $1,942 in early February before retracing, but key moving averages provided support, preventing a sharper decline. The higher lows in price action suggest that buyers are still in control, reinforcing bullish momentum. Yesterday, XAU/USD hit an all-time high of $2,947, fueled by intensifying fears of a global trade war and heightened economic instability. These concerns have bolstered demand for safe-haven assets, pushing gold prices toward new record levels.
XAU/USD – H4 Chart
USD/JPY Dives Below 150
USD/JPY climbed nearly 20 cents as it rallied form below 140 in September and approaching 159 in January. But, the price has been falling for more than a month. The 200 SMA (purple) was holding as support on the daily chart, but yesterday this moving average was broken and USD/JPY fell below 150. USD/JPY – Daily Chart
Cryptocurrency Update
Will Bitcoin Break out of the Range?

BTC/USD – Daily chart
Ethereum Retests the 20 Daily SMA
Ethereum (ETH) has faced intense selling pressure since surpassing $4,000 in late 2024. A flash crash on Monday sent ETH plummeting below $2,000, cutting its value nearly in half before a partial recovery. While sentiment remains bearish, a sustained hold above the $2,000 support level and improved market conditions could help Ethereum regain upward momentum. ETH/USD – Daily Chart
- Check out our free forex signals
- Follow the top economic events on FX Leaders economic calendar
- Trade better, discover more Forex Trading Strategies
- Open a FREE Trading Account
Related Articles

Comments
Sidebar rates
Related Posts
