Toncoin Whales Pour $250M Into TON as Price Tests Critical $4 Resistance
Toncoin (TON) has entered a critical phase as the cryptocurrency consolidates near the $4 mark amidst significant whale accumulation and
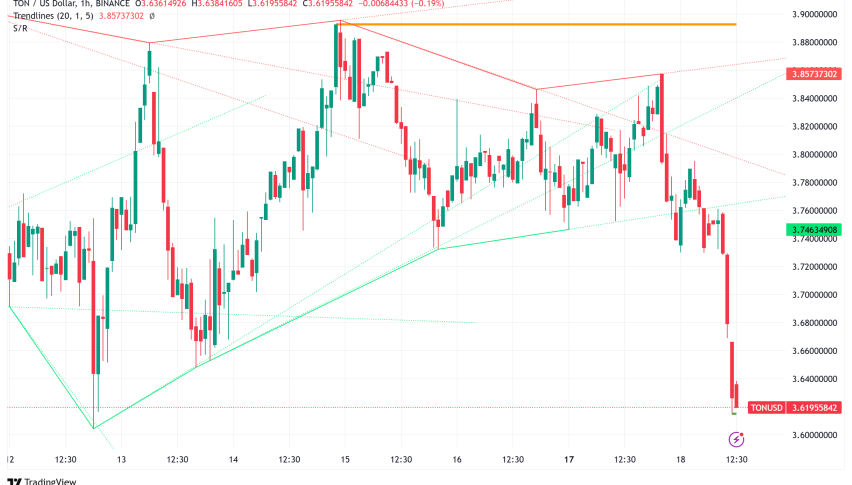
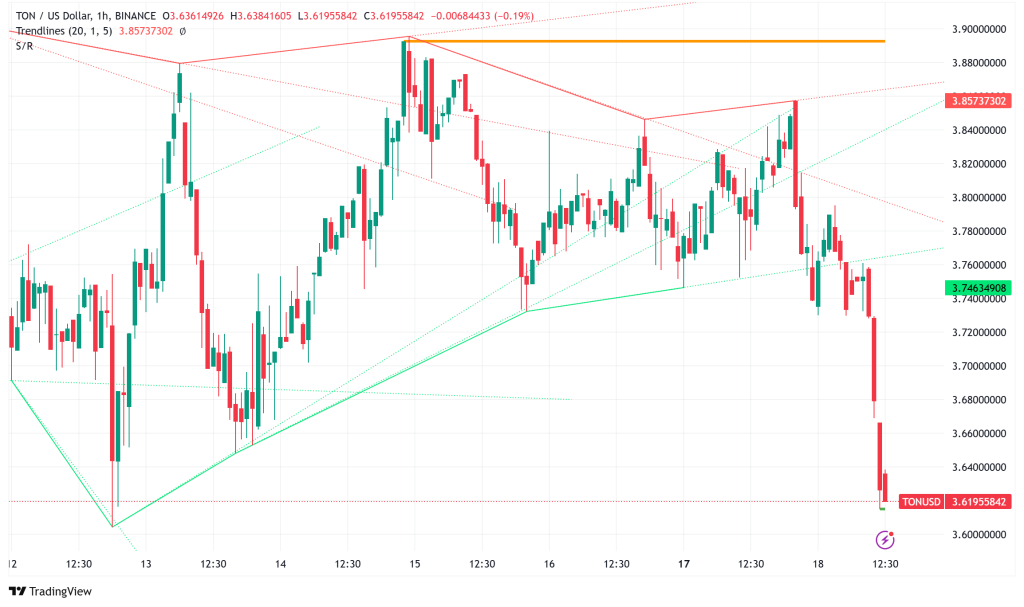
Live TON/USD Chart
[[TON/USD-graph]]
Toncoin (TON) has entered a critical phase as the cryptocurrency consolidates near the $4 mark amidst significant whale accumulation and declining volatility. The latest market data reveals a complex picture of institutional interest and technical indicators that could signal an impending breakout.
$250M Whale Buying Spree: 68M TON Tokens Accumulated in Just 3 Days
Notably, since February 14, when the US Securities and Exchange Commission accepted fresh Dogecoin ETF filings, whale wallets have gathered around 68 million TON tokens—valued at almost $250 million. Despite present price consolidation, this significant acquisition by big holders points to increasing institutional confidence in TON’s long-term prospects.
The increase in whale activity corresponds with more general market changes in the Proof-of- Work (PoW) industry, which has attracted fresh interest since the SEC took alternative cryptocurrency ETFs under review. TON’s next significant price action could find roots in this institutional movement.
TON Network Activity Diverges: Small Holders Up 32% While Whales Show Mixed Signals
On-chain metrics reveal a complex picture of TON’s market dynamics:
- Daily active addresses down 45% from August 2024 peak when price exceeded $7.50
- Addresses holding 1-100 TON increased 32% since October 2024
- Risk Exposure Ratio hits new all-time high of 0.24 in early 2025
- Long-term holders (>400 days) show 92% retention rate, suggesting strong conviction
12-Day Price Compression: Volatility Hits Record Low as Volume Rises 27%
With important technical indicators pointing to increasing pressure for a breakout, the price action shows TON trading in a shockingly narrow range between $3.70 and $3.90 during the previous 12 days:
- With the upper band at $4.00 and the lower band at $3.21, the Bollinger Bands have become much more squeezed.
- Readings of 16.79 for the Money Flow Index (MFI) indicate oversold circumstances
- Over three successive sessions, daily trade volume has exhibited steady rises.
- With a 50-day moving average of $4.79, the resistance level is clearly somewhat high.
Although the Parabolic SAR shows a continuous bearish trend, oversold conditions and rising volume point to possible trend reversal.
TON Needs to Break $4.50 for Trend Reversal
For TON to establish a convincing bullish trend, several key levels must be conquered:
- Immediate resistance at $4.00 (current Bollinger Band upper limit)
- Critical resistance at $4.50 (previous support turned resistance)
- Strategic 50-day moving average at $4.79
The presence of sustained whale buying amid oversold conditions suggests potential for upward movement, but the bearish market structure requires clearing these key levels for confirmation.
Toncoin Price Outlook: Convergence of 3 Critical Factors in the Near-Term
The market appears primed for a significant move based on three key developments:
- Unprecedented whale accumulation: $250M inflow in 72 hours
- Record low volatility: 2% trading range over 12 days
- Volume surge: 27% increase in daily trading activity
While technical indicators suggest an imminent volatility expansion, the direction will likely depend on TON’s ability to maintain support above $3.70 and challenge the crucial $4.00-$4.50 resistance zone. The substantial institutional accumulation provides a strong fundamental backdrop, but traders should monitor volume patterns and whale activity for confirmation of the next major move.
- Check out our free forex signals
- Follow the top economic events on FX Leaders economic calendar
- Trade better, discover more Forex Trading Strategies
- Open a FREE Trading Account
Related Articles
Comments
Sidebar rates
Related Posts
