Forex Signals Brief Feb 18: RBA Cuts Rates, Canada Inflation Next!
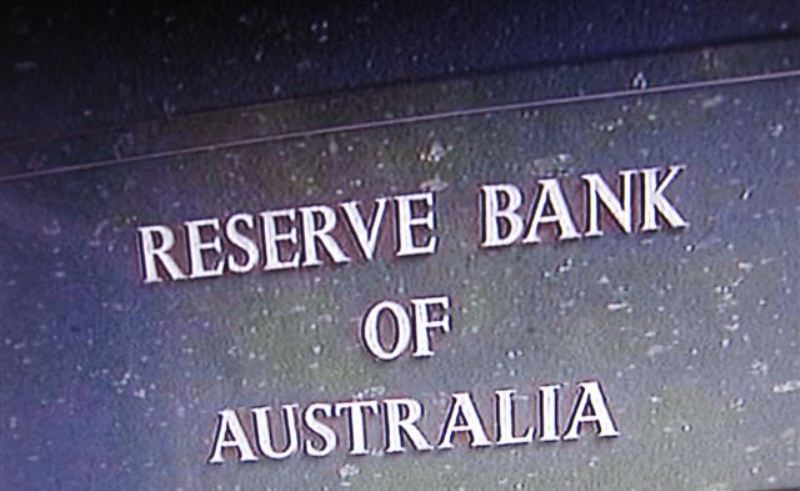
The Reserve Bank of Australia cut interest rates today, while later, CPI inflation is expected to show an increase in Canada for January.

U.S. President Donald Trump reaffirmed his commitment to imposing reciprocal tariffs on countries that levy duties, VAT, or subsidies on American imports. This stance is part of his broader strategy to rebalance trade policies and protect U.S. industries.
Meanwhile, EU leaders convened to discuss shifts in defense strategy, acknowledging a new reality in global self-defense. Trump is also pressing for $500 billion in compensation for the United States’ involvement in the Ukraine-Russia conflict, a move that could strain international relations further.
Today’s Market Expectations
RBA’s Rate Cut and Economic Outlook
The Reserve Bank of Australia (RBA) has cut interest rates for the first time since November 2020, when rates were slashed to 0.1%. The current rate cut follows a tightening cycle that began in May 2022, which saw rates climb to 4.35% by November 2023 before holding steady.
This cut is being described as a ‘hawkish’ easing, suggesting that future rate reductions will be cautious and spaced out. The RBA’s forecasts suggest that:
- Inflation (CPI) will be 2.4% by June 2025, 3.2% by June 2026, and 2.7% by June 2027.
- GDP growth is projected at 2.0% in 2025, 2.3% in 2026, and 2.2% in 2027.
With a quarterly approach to further cuts, the pace will depend on incoming economic data.
UK Labor Market Data Shows Mixed Signals
The UK’s ILO unemployment rate for December held steady at 4.4%, defying expectations of a slight increase to 4.5%, according to the Office for National Statistics (ONS).
- Employment change came in at 107k, surpassing the forecast of 48k and significantly improving from the prior 35k reading.
- Average weekly earnings rose by 6.0%, slightly higher than the expected 5.9%, while ex-bonus earnings met forecasts at 5.9%, both up from 5.6% previously.
- January payrolls increased by 21k, a strong rebound from the prior reading of -47k, which has since been revised to -14k.
The labor market remains resilient, but the data will be closely watched for implications on wage growth, inflation, and future monetary policy.
In Canada, the year-over-year Consumer Price Index (CPI) is forecast to remain at 1.8%, unchanged from the previous year. The month-over-month CPI is expected to show no change (0.0%), compared to a -0.4% decline in the previous year. Additionally, the Trimmed-Mean CPI is predicted to rise to 2.6% from 2.5%, while the Median CPI is expected to edge up to 2.5% from 2.4% last year.
Inflation has remained within the Bank of Canada’s (BoC) target range for nearly a year, with the central bank recently noting that risks to inflation remain balanced, aside from potential tariff concerns. This has led the BoC to adopt a neutral policy stance, signaling that any rate cuts will likely proceed at a gradual pace.
Economic data from Canada has shown signs of strengthening following the BoC’s previous monetary easing measures. However, the Canadian dollar (CAD) has been held back primarily due to trade uncertainties. With recent improvements in trade stability, the Loonie now has room to appreciate, supported by a more stable economic outlook.
Yesterday there was some volatility in forex, with the USD trying to make a comeback, but it was unable to. Stock markets remained bullish, so we also remained long on stocks, while selling the rebound in crude Oil, after the Bloomberg rumours were denied by Russia. Ethereum jumped higher, which was positive for our buy ETH signal.
You Can’t Keep Gold Down
Despite President Donald Trump’s decision to suspend tariffs, financial markets remained cautious, driving demand for safe-haven assets like gold. On Tuesday, gold experienced a sharp pullback but found support at the 50-day SMA (yellow) on the H4 chart, eventually climbing back above the 20-day SMA (gray) by Wednesday. The upward momentum, however, stalled near $2,900, with profit-taking and improved risk sentiment pushing prices lower. Even after reaching a fresh high of $2,942 on Tuesday and testing $2,940 again on Friday, gold slipped below the 50-day SMA and $2,900. However, buyers re-entered the market, driving prices back toward recent highs. XAU/USD – H4 Chart
USD/JPY Still Remain Bullish on the Weekly Chart
The USD/JPY pair initially recovered last week after suffering a four-cent plunge the previous week, following the Bank of Japan’s (BOJ) surprise hawkish rate hike, which strengthened the yen. A combination of rising inflation and increased consumer spending also contributed to the yen’s strength. Despite the early gains, investors failed to sustain the rally, with USD/JPY closing near 152. Early this morning, the pair continued to drop after an impressive Japan GDP report, which projected 2.8% economic growth for 2024. The strong economic outlook reinforced market expectations that the BOJ may maintain its tightening stance, putting further pressure on the dollar. USD/JPY – Daily Chart
Cryptocurrency Update
Bitcoin Continues to Remain Between MAs

BTC/USD – Daily chart
Ethereum Starts to Reverse Higher
Ethereum, on the other hand, has faced heavy selling pressure, struggling after breaking past $4,000 in late 2024. A flash crash on Monday wiped out nearly 50% of its value, dragging ETH down to $2,000 before staging a modest recovery. While bearish risks persist, Ethereum could see renewed bullish momentum if $2,000 holds as strong support and broader market sentiment improves. ETH/USD – Daily Chart


