Ethereum’s Path to $15,000: Analysts Predict Explosive Growth
Ethereum’s bull run is picking up pace again after a period of consolidation. While ETH is still below $3,000, analysts are confident...

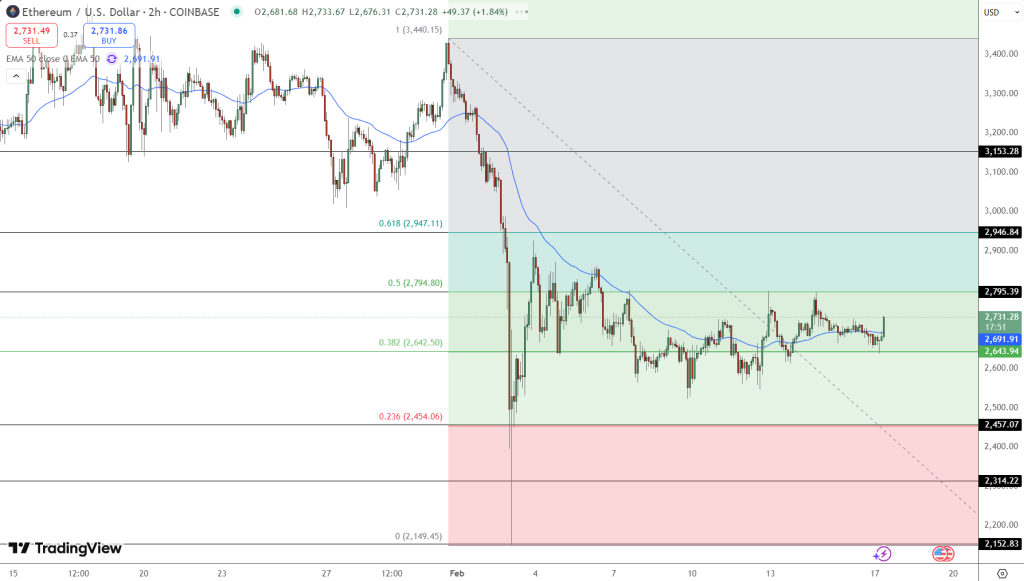
Live ETH/USD Chart

Ethereum’s bull run is picking up pace again after a period of consolidation.

While ETH is still below $3,000, analysts are confident it will pass $15,000 this cycle. Crypto Rover, a popular market strategist, says “ETH will teleport over $15,000.”
Market data supports this bullish view with analysts pointing to key technical patterns that could lead to a big breakout. Some think ETH will first hit $7,000 before making a move to five figures.
Key Patterns Fueling Ethereum’s Surge
Analysts are highlighting these trends:
Head and Shoulders Formation: CryptoGoos, a well known chart analyst, has a head and shoulders pattern on ETH’s weekly chart. This is a big trend, could take ETH to $6,000.
Copper Price Correlation: Some compare ETH to copper’s price, like Bitcoin to gold. This means ETH could go up big time above $5,000.
Symmetrical Triangle Breakout: Crypto Admiral and Crypto GEMs have a big symmetrical triangle pattern on ETH’s chart. If ETH breaks above $3,200 it could go to $5,600 and then more.
Catalysts Behind Ethereum’s Potential Rally
Here are the catalysts:
Pectra Upgrade: The Pectra upgrade will be on testnets in late Feb and early March with full activation April 8. This will make ETH more attractive to institutional investors.
Historical Price Action Repeats: Mikybull Crypto notes that ETH’s current price action is similar to Feb 2024 when ETH made a big breakout. Same setup now could mean a rally.
Double Bottom Formation: Ted has a double bottom on ETH’s chart, a bullish reversal. He says “Ethereum’s breakout pump will be legendary.”
Current Market Outlook
At the time of writing, Ethereum is trading at approximately $2,690, reflecting a 1.38% daily decline. Despite a 2.57% increase over the past week, ETH remains down 19% on the monthly chart. Its market capitalization stands at $324.63 billion, positioning Ethereum as the second-largest cryptocurrency.
With strong technicals, bullish sentiment and a big upgrade coming, Ethereum’s path to $15,000 is getting more and more real. The next few months will be the decider if ETH will reach this target and trigger an alt season.
- Check out our free forex signals
- Follow the top economic events on FX Leaders economic calendar
- Trade better, discover more Forex Trading Strategies
- Open a FREE Trading Account
Related Articles
Comments
Sidebar rates
Related Posts
