Gold Price Forecast: Big Moves Ahead as Fed, Trump & PMI Take Center Stage

Gold (XAU/USD) enters the new trading week with uncertainty, as investors brace for key economic events that could drive volatility. After dropping to $2,882, gold is struggling to reclaim the $2,900 level, with technical indicators suggesting potential shifts in momentum.
This week’s focus will be on Federal Reserve updates, economic data, and geopolitical developments.
Key Events That Could Shake Gold Prices
| Broker | Review | Regulators | Min Deposit | Website | |
|---|---|---|---|---|---|
| 🥇 |  | Read Review | FCA, CySEC, ASIC, MAS, FSA, EFSA, DFSA, CFTC | USD 100 | Visit Broker |
| 🥈 | Read Review | FSCA, FSC, ASIC, CySEC, DFSA | USD 5 | Visit Broker | |
| 🥉 |  | Read Review | CySEC, MISA, FSCA | USD 25 | Visit Broker |
| 4 |  | Read Review | ASIC, BaFin, CMA, CySEC, DFSA, FCA, SCB | USD 200 | Visit Broker |
| 5 |  | Read Review | ASIC, FCA, CySEC, SCB | USD 100 | Visit Broker |
| 6 | Read Review | FCA, FSCA, FSC, CMA | USD 200 | Visit Broker | |
| 7 | Read Review | BVI FSC | USD 1 | Visit Broker | |
| 8 |  | Read Review | CBCS, CySEC, FCA, FSA, FSC, FSCA, CMA | USD 10 | Visit Broker |
| 9 |  | Read Review | ASIC, CySEC, FSCA, CMA | USD 100 | Visit Broker |
| 10 |  | Read Review | IFSC, FSCA, ASIC, CySEC | USD 1 | Visit Broker |
The upcoming week is packed with market-moving events, starting with FOMC Member Waller’s speech on Feb 18, which could provide insights into the Fed’s stance on rate cuts.
Later that day, Empire State Manufacturing Index data will reveal the state of U.S. economic activity.
- On Feb 19, the FOMC meeting minutes will be a crucial event, giving traders more clarity on policymakers’ views on inflation and interest rates. If the Fed signals a delay in rate cuts, gold could face downward pressure as the dollar strengthens.
- Feb 20 brings Unemployment Claims and the Philly Fed Manufacturing Index, key indicators for labor market strength. A higher-than-expected jobless claims figure could support gold as traders anticipate future rate cuts.
- Meanwhile, crude oil inventory data may indirectly impact inflation expectations, influencing gold’s appeal as an inflation hedge.
- The week wraps up with Flash Manufacturing & Services PMI on Feb 21, followed by Existing Home Sales and the University of Michigan Consumer Sentiment report.
- If PMI numbers show economic resilience, gold may struggle to gain ground. However, weaker data could boost safe-haven demand.
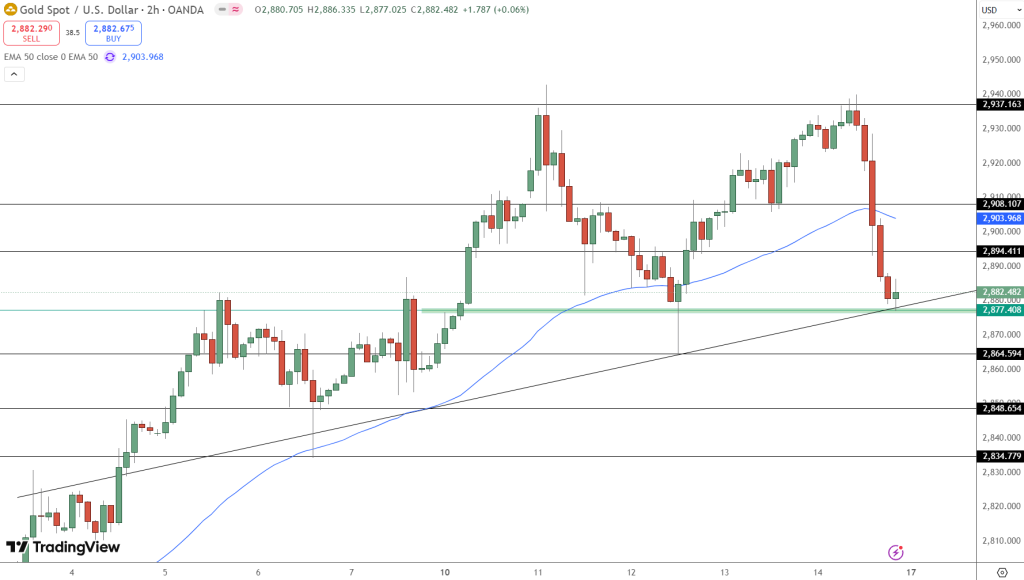
Gold Technical Analysis: Key Levels to Watch
Gold is currently consolidating above its key support at $2,877, with a bullish trendline providing temporary stability. The 50-day EMA at $2,903 remains a key resistance level, preventing further upside momentum.
- Immediate Resistance: $2,894
- Next Resistance: $2,908, then $2,937
- Immediate Support: $2,877
- Next Support: $2,864, followed by $2,848
If gold holds above $2,877, it could retest the $2,894 and $2,908 levels. A break above these levels would shift momentum toward $2,937. However, if support fails, expect a decline toward $2,864.
Final Thoughts: What’s Next for Gold?
Gold’s direction will depend on how the Fed minutes and key economic data unfold. A hawkish Fed could pressure gold prices, while weak economic indicators may fuel a rally. With volatility expected, traders should keep a close eye on $2,877 for a potential rebound or breakdown.
Key Takeaways:
- Fed Minutes & PMI Reports to determine gold’s next move.
- Support at $2,877 remains critical for bulls.
- Break above $2,894 could lead to $2,908 and beyond.


Add 3442

Related Posts
Add 3440