Forex Signals Brief Feb 14: Eurozone GDP, US Retail Sales Close the Week
Live BTC/USD Chart

Given the news of tariff announcements and hotter-than-expected PPI data, one might have expected the US dollar to strengthen—but instead, it weakened. The headline PPI report appeared strong, but a closer look at the components suggested that core PCE, the Fed’s preferred inflation metric, is likely to decline. Markets interpreted this as a dovish signal, causing Treasury yields to give up all of yesterday’s CPI-driven gains.
Additionally, the reciprocal tariff announcement had been anticipated for a week, reducing its shock effect. With a six-week delay in implementation, markets are now betting that these tariffs will either be negotiated, mitigated, or not enforced as strictly as initially feared.
US Stock Market Gains Despite Trade Concerns
- Dow Jones: +355 points (+0.8%) at 44,711
- S&P 500: +63 points (+1%) at 6,115, just 3 points shy of its record close
- NASDAQ: +296 points (+1.5%) at 19,945
- Russell 2000 (Small-Caps): +26 points (+1.17%) at 2,282
Forex and Commodities Reactions
- USD/JPY erased 1.5 cents, reversing all of yesterday’s gain.
- USD/CAD dropped more than 1 cent, dipping below levels seen before Trump’s 25% tariff announcement on Canada and Mexico.
- DAX 40 climbed another 1%, continuing its steady rise.
- UK FTSE 100 fell 1.5% following weak UK GDP data.
- Gold surged rapidly toward the $3,000 mark, with buyers stepping in aggressively, pushing prices near Tuesday’s highs.
Conclusion
Markets have largely shrugged off inflation fears and trade war concerns, instead focusing on softer inflation indicators and potential tariff adjustments. Equities remain strong, with gold on track to break $3,000 and risk sentiment keeping the US dollar under pressure.
Today’s Market Expectations
Traders are keeping a close eye on key technical levels and macroeconomic developments in order to predict the next move in the financial markets. Yesterday, gold resumed its upward momentum after falling nearly $80, but it remained below $2,900. The movements of forex pairs and stock markets highlight the mixed sentiment in financial markets. Gold continues to rise as investors seek a safe haven amid uncertainty, while US stock markets struggled with resistance and volatility.
Gold Buyers Are Relentless
Gold experienced a sharp pullback on Tuesday but found support at the 50-day SMA (yellow) on the H4 chart, rebounding above the 20-day SMA (gray) on Wednesday. However, it failed to hold above $2,900 after hitting a new high of $2,942 during the Asian session, retreating in the US session due to improved risk sentiment and profit-taking. Despite this, support at the 20-day SMA has held firm, generating a fresh buy signal. On Wednesday, gold reversed higher, climbing above the $2,900 level again.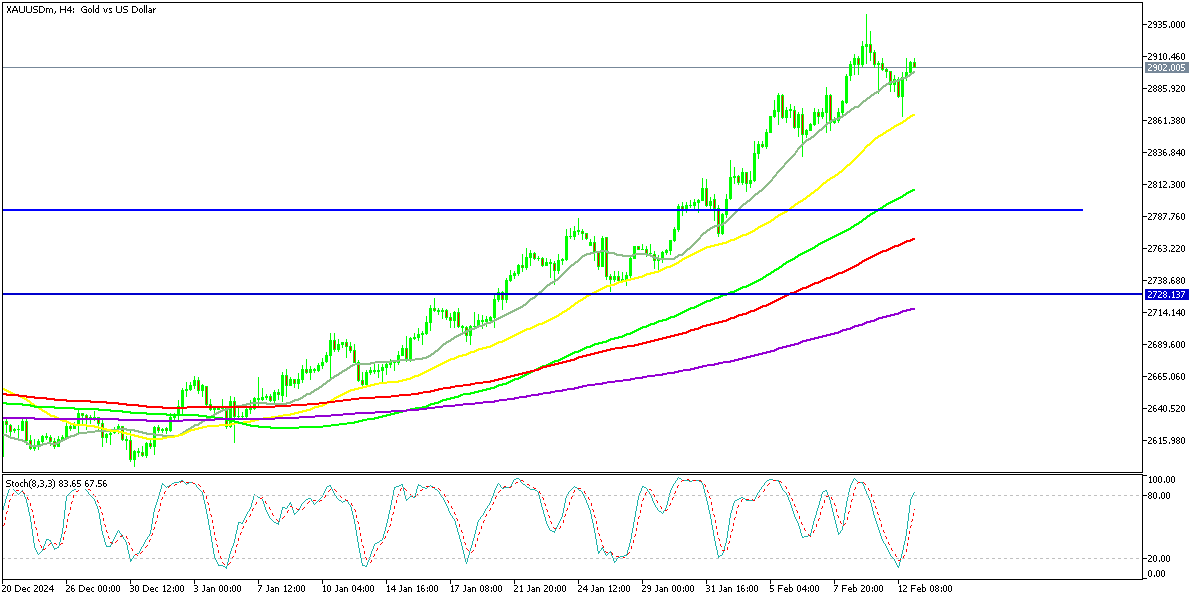 XAU/USD – H4 Chart
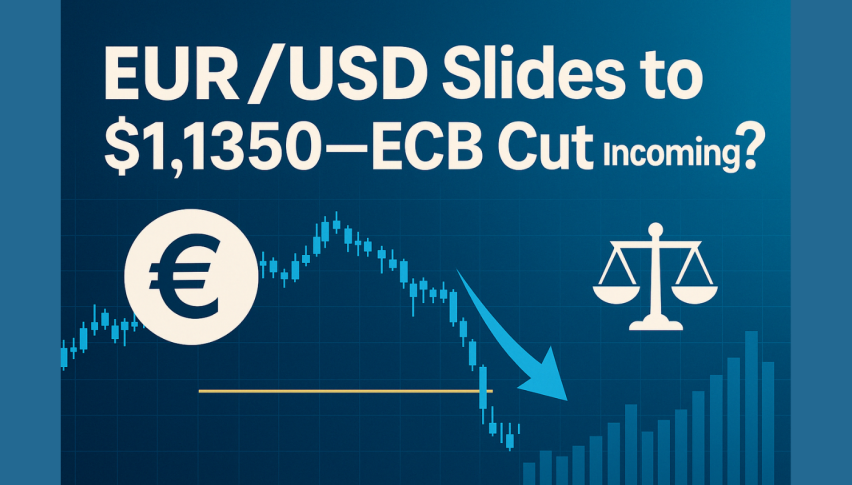
EUR/USD Fail to Hold Above the 50 Daily SMA Again
EUR/USD has been in a consistent downtrend since October, dropping 10 cents despite occasional rebounds, such as January’s brief surge above 1.05 and last week’s move past 1.04. Buying interest remains weak, with lower highs reinforcing the bearish outlook. The European Central Bank’s dovish stance continues to weigh on the euro, while the US dollar benefits from economic resilience and the Federal Reserve’s cautious policy approach. If this dynamic persists, further declines in EUR/USD could follow.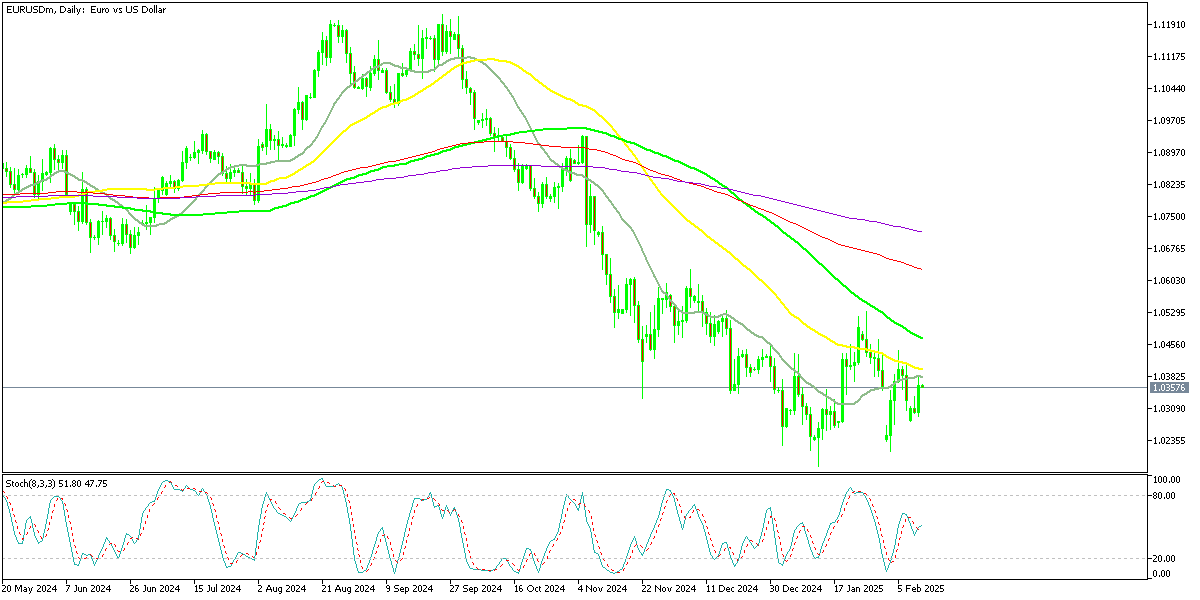 EUR/USD – Daily Chart
Cryptocurrency Update
Bitcoin Continues to Remain Between MAs
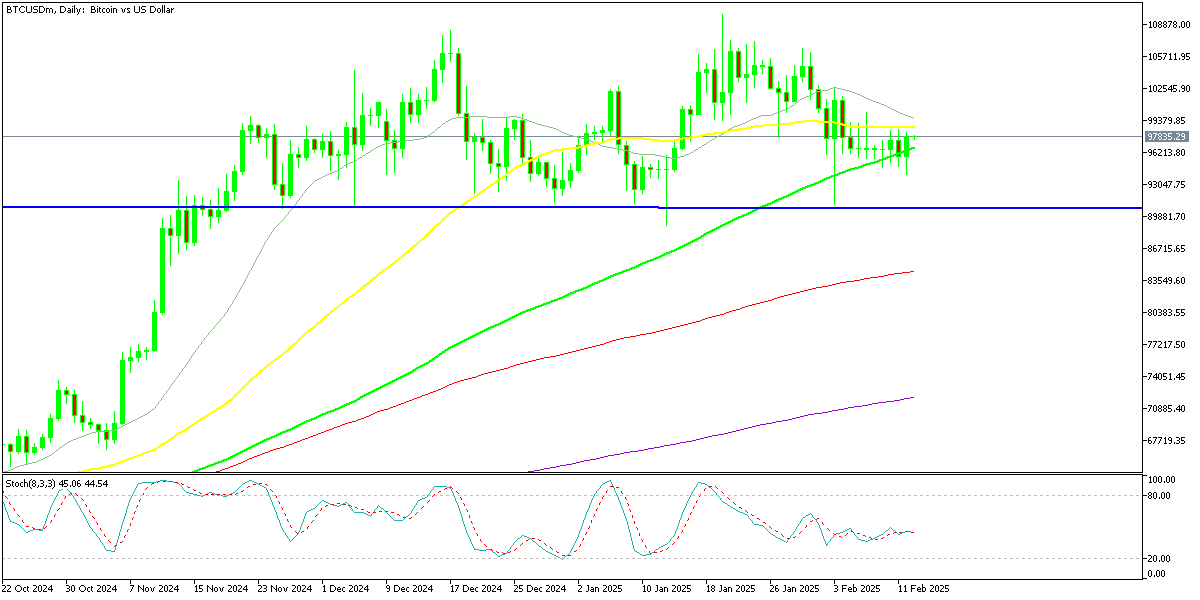
BTC/USD – Daily chart
Ethereum Starts to Reverse Higher
Ethereum has faced intense selling pressure, struggling to sustain gains after approaching $4,000 in late 2024. A flash crash on Monday slashed its value by 50%, briefly sending ETH down to $2,000 before staging a modest recovery. While downside risks persist, Ethereum could see a rebound if technical support at $2,000 holds and broader market sentiment improves.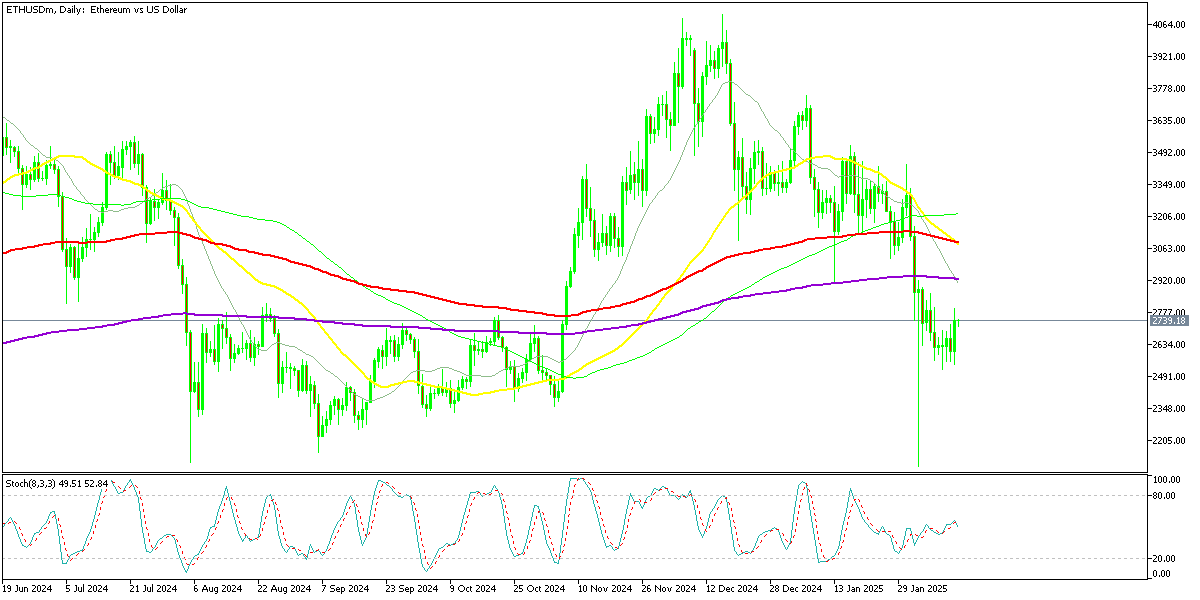 ETH/USD – Daily Chart
- Check out our free forex signals
- Follow the top economic events on FX Leaders economic calendar
- Trade better, discover more Forex Trading Strategies
- Open a FREE Trading Account
Related Articles


Comments
Sidebar rates
Related Posts
