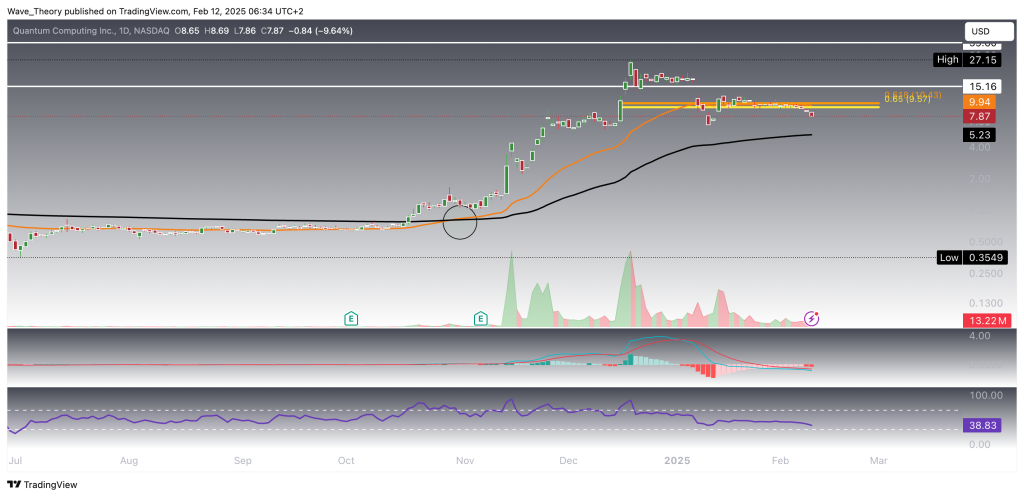
On the daily chart, the EMAs have also formed a golden crossover, reinforcing a bullish trend in the short to medium term. However, the MACD lines are bearishly crossed, with the histogram ticking lower since yesterday, signaling weakening bullish momentum. The RSI remains neutral, not providing a clear directional bias. QUBT is currently holding significant support at the 200-day EMA at $5.23, where a potential bounce could occur, targeting the golden ratio resistance level at $10.
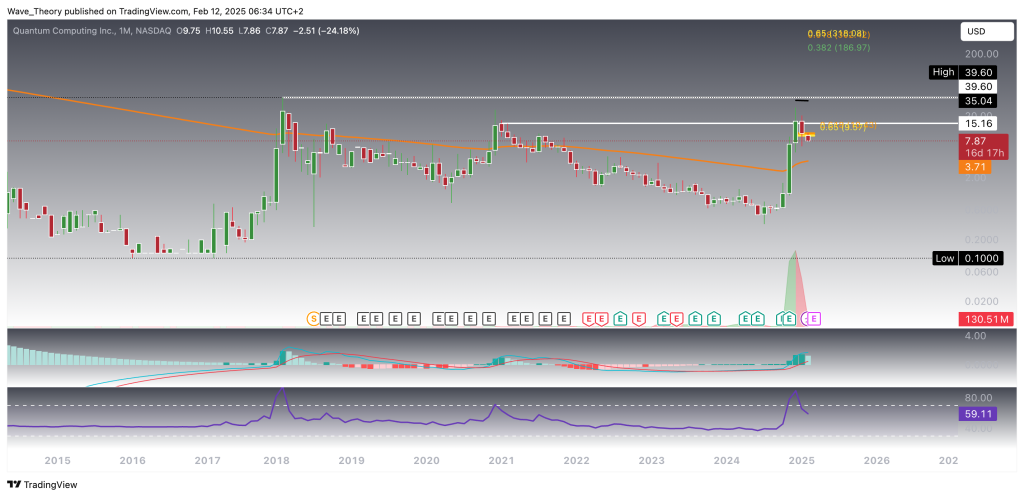
Quantum Computing Inc. (QUBT) Stock Undergoes Steep Correction After Quant Hype Has Cooled Off
Konstantin Kaiser•Wednesday, February 12, 2025•2 min read
Quantum Computing Inc. (QUBT) Breaks Below Important Fibonacci Support Level
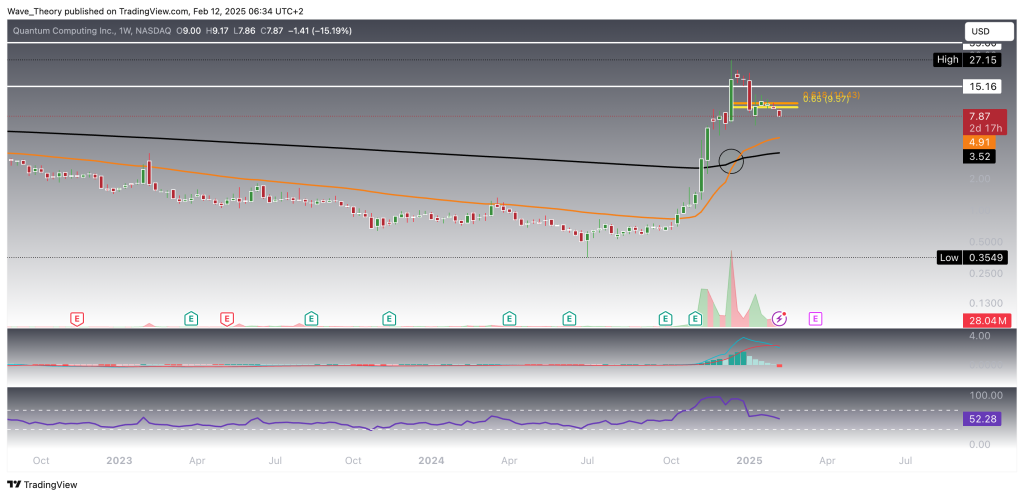
Weekly Chart: A Golden Crossover Has Appeared
QUBT Stock: Daily Chart Presents Bearish Signals
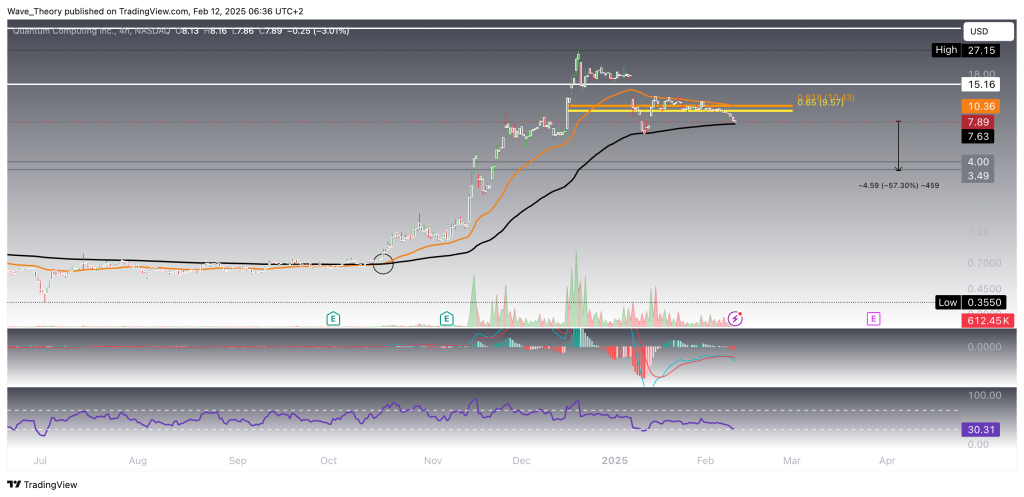
4H-Chart Hints At Downside of 57.3 %
- Check out our free forex signals
- Follow the top economic events on FX Leaders economic calendar
- Trade better, discover more Forex Trading Strategies
- Open a FREE Trading Account
ABOUT THE AUTHOR
See More
Konstantin Kaiser
Financial Writer and Market Analyst
Konstantin Kaiser comes from a data science background and has significant experience in quantitative trading. His interest in technology took a notable turn in 2013 when he discovered Bitcoin and was instantly intrigued by the potential of this disruptive technology.
Related Articles

Comments
Subscribe
Login
Please login to comment
0 Comments
Oldest
Sidebar rates
Related Posts
