BTC, XRP Ready for Breakout as Institutional Interest Increases – Up or Down?

Ripple (XRP) and Bitcoin (BTC) have been consolidating for several days after the retreat, but we’re likely to see a breakout soon, with the upside being more favourable.
| Broker | Review | Regulators | Min Deposit | Website | |
|---|---|---|---|---|---|
| 🥇 |  | Read Review | FCA, CySEC, ASIC, MAS, FSA, EFSA, DFSA, CFTC | USD 100 | Visit Broker |
| 🥈 | Read Review | FSCA, FSC, ASIC, CySEC, DFSA | USD 5 | Visit Broker | |
| 🥉 |  | Read Review | CySEC, MISA, FSCA | USD 25 | Visit Broker |
| 4 |  | Read Review | ASIC, BaFin, CMA, CySEC, DFSA, FCA, SCB | USD 200 | Visit Broker |
| 5 |  | Read Review | ASIC, FCA, CySEC, SCB | USD 100 | Visit Broker |
| 6 | Read Review | FCA, FSCA, FSC, CMA | USD 200 | Visit Broker | |
| 7 | Read Review | BVI FSC | USD 1 | Visit Broker | |
| 8 |  | Read Review | CBCS, CySEC, FCA, FSA, FSC, FSCA, CMA | USD 10 | Visit Broker |
| 9 |  | Read Review | ASIC, CySEC, FSCA, CMA | USD 100 | Visit Broker |
| 10 |  | Read Review | IFSC, FSCA, ASIC, CySEC | USD 1 | Visit Broker |
Following President Trump’s tariff announcement in early February, risk assets took a hit, with BTC/USD briefly dropping below $90,000 before staging a recovery past the $100K threshold. However, buyers failed to sustain momentum, leading to a slow drift downward. Bitcoin fell below $95K, where the 100-day SMA had been providing key support on the daily chart.
Bitcoin Chart Daily – Stuck Between MAs

Meanwhile, 16 U.S. states, including Texas and Florida, are exploring Bitcoin adoption through proposed legislation that would allow them to allocate up to 10% of their excess reserves into digital assets. This increasing state-level adoption could fuel a global push for Bitcoin as a reserve asset, making it a potential buying opportunity. That said, BITCOIN must first reclaim the 50-day SMA and hold above $100K to open the door for a retest of January’s all-time high near $110K.
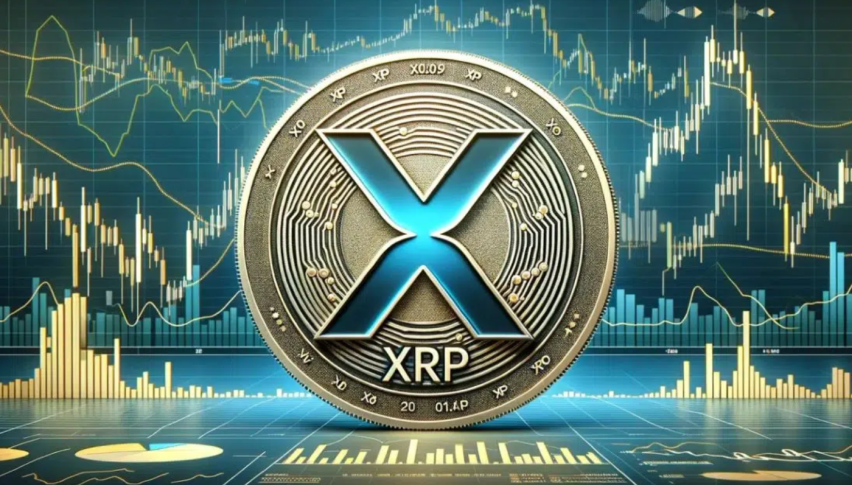
Ripple Daily Chart – XRP Struggles at Key Resistance, Eyes ETF Approval

After hitting an all-time high of $3.39 in mid-January, XRP experienced a steep pullback, dropping below $3, with losses accelerating in early February as the price briefly dipped below $2. However, buyers stepped in near the $2 level, triggering a $1 bounce. The failure to break above the 50-day SMA has kept the price in check, leading to a consolidation range between $2.25 and $2.55. If XRP can reclaim the 50-day SMA at $2.70, which previously acted as support but has now turned into resistance, it could target the psychological $3 mark, particularly if an XRP ETF gains approval.
Crypto ETF Momentum Signals Institutional Interest Surge
Optimism in the crypto market is rising following Nasdaq’s filing for XRP and Litecoin ETFs. Major financial firms continue to apply for crypto exchange-traded funds (ETFs), reinforcing the growing institutional demand for digital asset investment products. Bloomberg analysts estimate a 65% chance that an XRP ETF will be approved by 2025, which could serve as a major catalyst for price appreciation across the broader crypto sector.
Ripple XRP Live Chart
Add 3442

Related Posts
Add 3440