Forex Signals Brief Feb 10: Trump, FED’s Powell, US Inflation to Set Tone for Stocks, Crypto and USD
This week we have the US CPI and PPI inflation data, FED's Powell testifying at Congress and the unexpected comments from Donald Trump.
Live BTC/USD Chart

This week we have the US CPI and PPI inflation data, FED’s Powell testifying at Congress and the unexpected comments from Donald Trump which will set the tome in financial markets, particularly the USD, stock markets and cryptocurrencies.
Last week stock markets opened with a big bearish gap after the release of DeepSeek, which sent the shares of Tech companies lower, dragging all risk assets such as cryptocurrencies down. However, markets stabilized and European stock indices such as the German Dax and UK FTSE100 reached some record levels. The Google stock ended the week 10% lower though, after the miss in iCloud revenue.
Cryptocurrencies also declined early in the week, with BTC slipping below $100K, but they stabilized later. Ethereum and Ripple coin lost around 50% of their value during the crash on Monday but recuperated some of the losses and we decided to go long on ETH/USD with a buy signal. Yesterday the decline resumed in the crypto market though.
This Week’s Market Expectations
Upcoming Events
Monday:
- NY Fed Inflation Expectations – Market gauge of future inflation trends.
Tuesday:
- US NFIB Small Business Optimism Index – Measures sentiment among small businesses, a key driver of the US economy.
- Fed Chair Powell Testimony – Potential insights into monetary policy and economic outlook.
Wednesday:
- US CPI – Crucial inflation data influencing Fed policy.
- Fed Chair Powell Testimony (Day 2) – Follow-up insights or clarifications.
- Bank of Canada (BoC) Meeting Minutes – Detailed view of BoC’s latest rate decision and economic assessment.
Thursday:
- Japan PPI – Tracks wholesale inflation, a leading indicator for consumer prices.
- UK GDP – Key economic growth indicator, crucial for BoE policy direction.
- Switzerland CPI – Inflation data impacting SNB’s policy stance.
- US PPI – Producer-level inflation, often a precursor to consumer inflation.
- US Jobless Claims – Weekly labor market health check.
- New Zealand Manufacturing PMI – Insight into NZ’s industrial sector strength.
Friday:
- US Retail Sales – Key indicator of consumer spending trends.
- US Industrial Production & Capacity Utilization – Measures manufacturing output and resource use, reflecting economic momentum.
The contrasting price movements of gold and cryptocurrencies highlight the mixed sentiment in financial markets. Gold continues to climb as investors seek a safe haven amid uncertainty, while Bitcoin and Ethereum struggle with resistance and volatility. Traders are closely monitoring key technical levels and macroeconomic developments to anticipate the next major market shifts.
Gold Prepares for the Next Push Toward $3,000
Gold appears poised for further gains, with a move beyond $2,800 likely and a push toward $3,000 becoming increasingly plausible amid strong bullish momentum. Recent US GDP data has reinforced gold’s appeal, enabling XAU/USD to maintain its breakout. Despite briefly dipping to $2,772 due to intraday fluctuations, gold quickly rebounded to $2,830, underscoring strong demand. The metal has sustained its upward trajectory, surging past $2,790 to a new peak of $2,798.40 while facing resistance.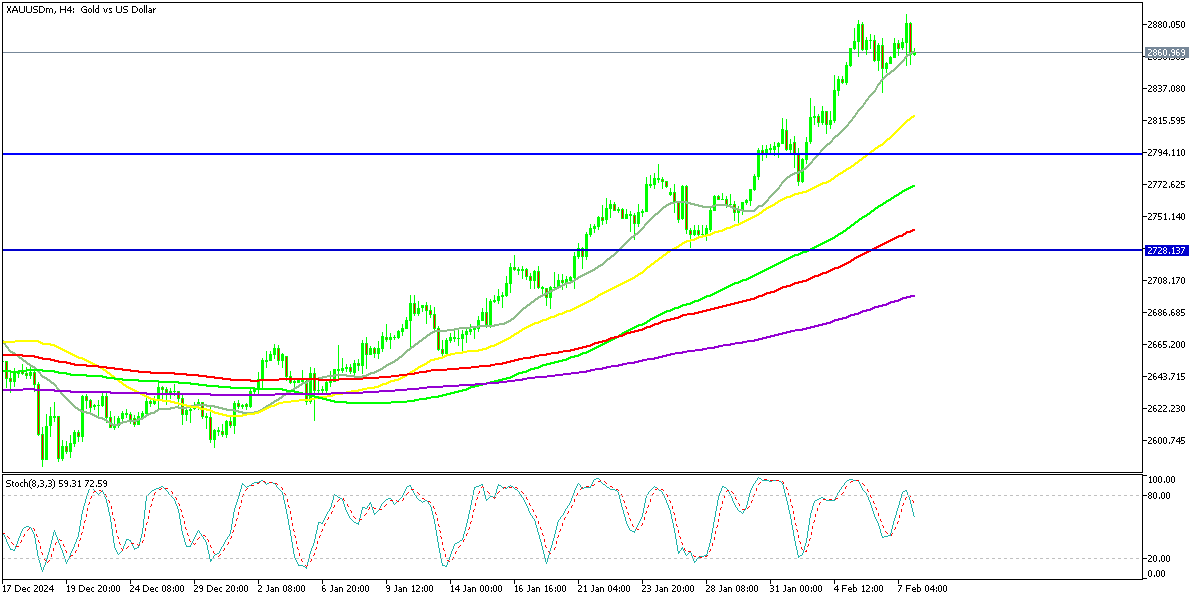
XAU/USD – H4 Chart
EUR/USD Continues to Make Lower highs
EUR/USD has been on a steep downtrend since October last year, losing around 10 cents, however the downtrend has slowed recently. In January we saw a bounce above 1.05 while last week we saw a bounce above 1.04, but buyers continues to fail and the highs keep getting lower. So, the trend remains bearish and the ECB has turned quite dovish, which suggests that EUR/USD might reach parity soon.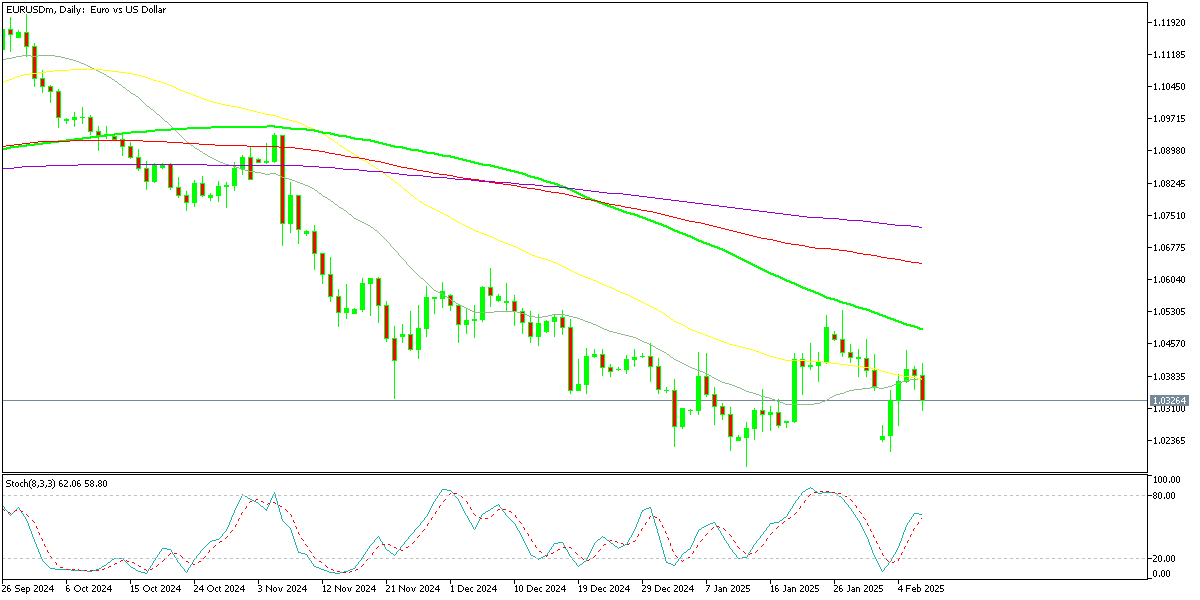
USD/CAD – Daily Chart
Cryptocurrency Update
Bitcoin Stays Below $100K
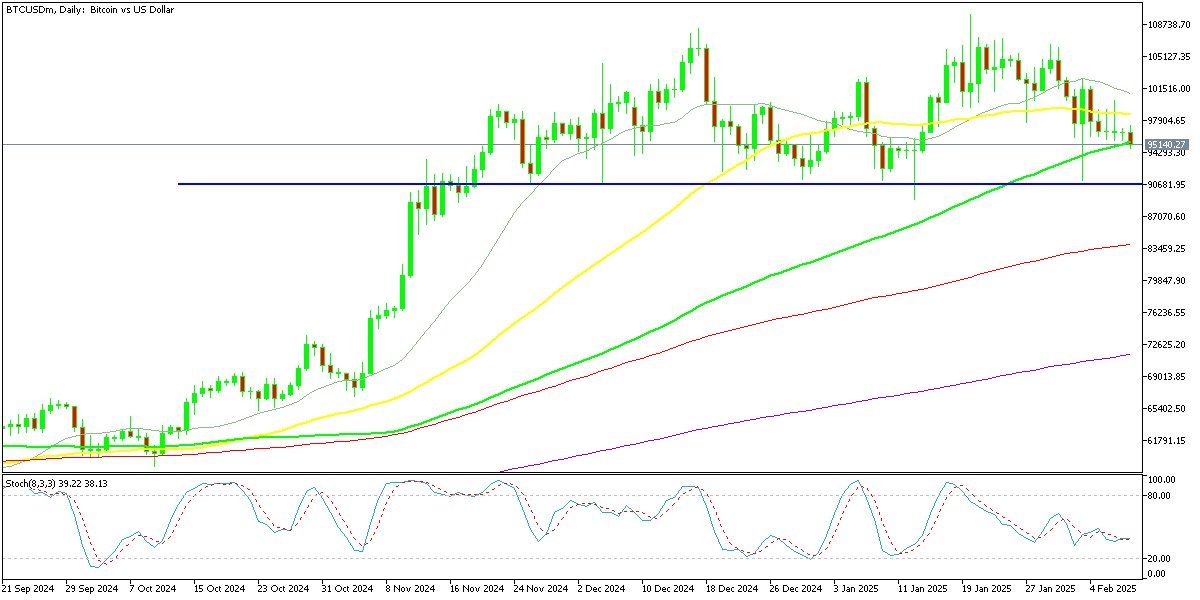
BTC/USD – Daily chart
Ethereum Snaps A Small Gain
Ethereum, in contrast, has struggled to sustain its gains and failed to achieve a new all-time high in late 2024. The price briefly approached $4,000 but encountered heavy selling pressure, preventing it from holding above that level. The recent flash crash on Monday saw Ethereum plunge to $2,000, erasing half its value before staging a short-lived recovery during the US session. However, renewed selling pressure has emerged, though a buying opportunity near $2,000 remains viable if moving averages provide support and the broader trend stays positive.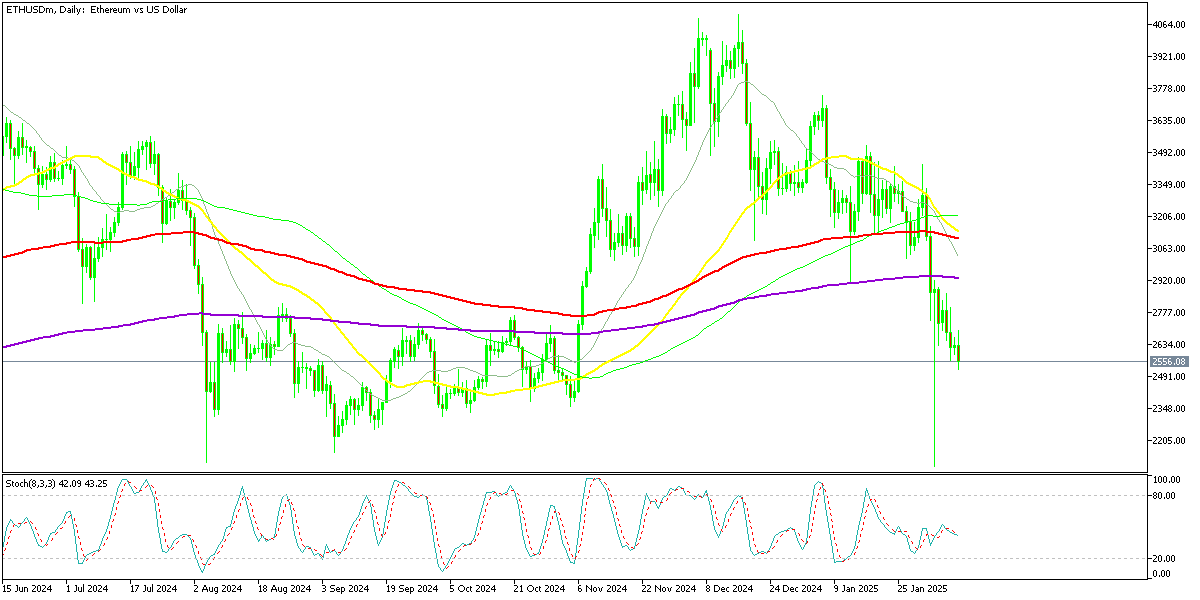
ETH/USD – Daily Chart
- Check out our free forex signals
- Follow the top economic events on FX Leaders economic calendar
- Trade better, discover more Forex Trading Strategies
- Open a FREE Trading Account
Related Articles


Comments
Sidebar rates
Related Posts
