MicroStrategy Stock (MSTR) Faces Rejection At Important Resistance Level

MicroStrategy’s stock performance will likely be tied to Bitcoin’s price action, given the company’s significant holdings of nearly 500,000 BTC. If Bitcoin continues its correction, MSTR may face additional downside risk.
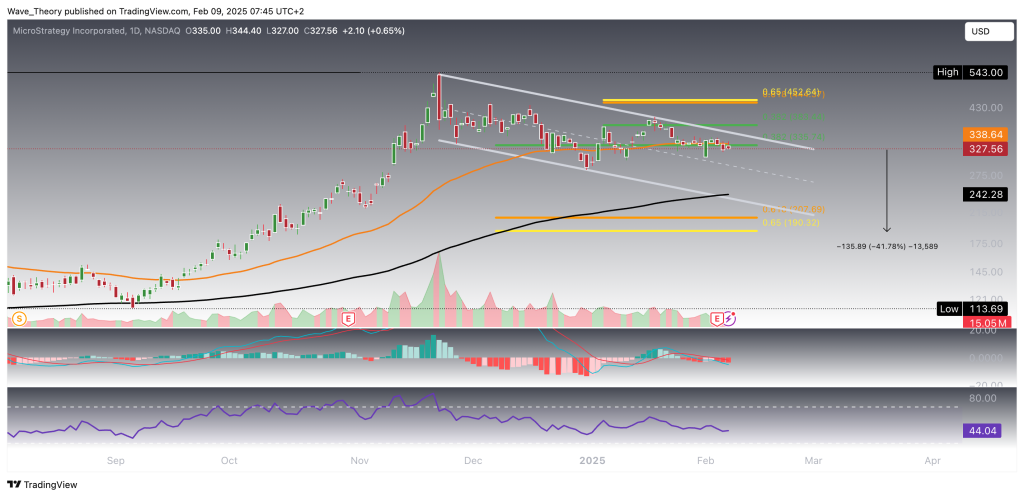
MicroStrategy (MSTR) Faces Bearish Pressure After Rejection at Key Fibonacci Level
MicroStrategy (MSTR) has entered a correction phase following its all-time high (ATH) of $543 in November. Currently, MSTR is trending lower within a parallel downward channel, recently facing rejection at the critical 0.382 Fibonacci resistance level of $383.44. This rejection increases the likelihood of further downside, as MSTR may break below the 50-day EMA support, which coincides with the 0.382 Fib level at $335. If that happens, it could signal a potential decline of up to 42%, with the next significant Fibonacci support situated at $190. Additionally, the 200-day EMA at $242 acts as further support.
Despite the near-term bearish momentum, the long-term bullish trend remains intact as long as MSTR stays above the golden ratio support at $190. A break below this level would invalidate the uptrend, transitioning the stock into a bearish trend. The EMAs continue to display a bullish crossover, confirming a bullish outlook for the stock in the short- to medium-term.
However, the technical indicators suggest caution. The MACD lines are crossed bearishly, with the histogram exhibiting a downward trend, while the RSI oscillates within neutral regions, indicating uncertainty in momentum.
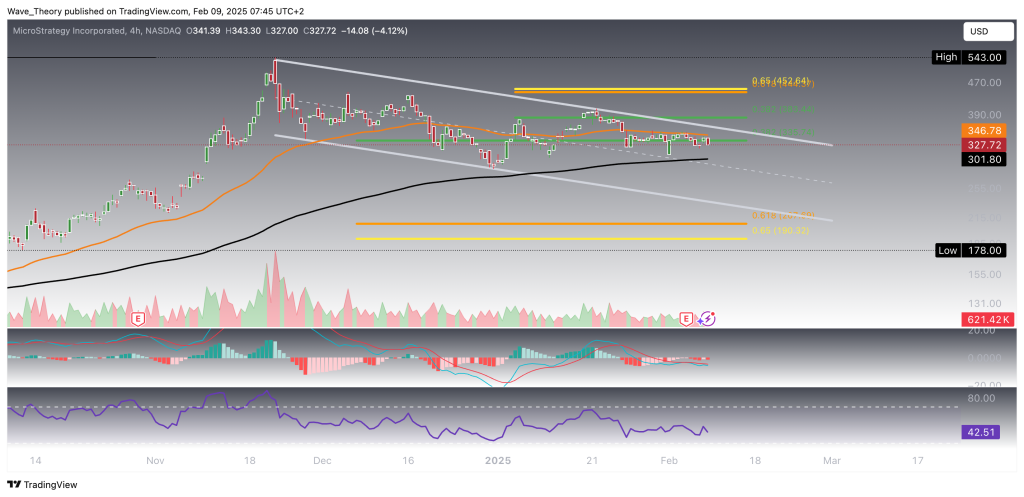
Will MicroStategy Break The 200-4H-EMA at $301.8?
On the 4-hour chart, MicroStrategy (MSTR) still shows a golden EMA crossover, confirming a bullish short-term trend. However, the stock has encountered a bearish rejection at the key Fibonacci resistance, reinforcing its correction phase. After being rejected at the 50-4H EMA level of $346.8, MSTR is now eyeing a potential test of the 200-4H EMA support at $301.8. A break below this level could signal further downside, potentially driving the price toward the golden ratio support at $190.
The technical indicators provide a mixed outlook. The RSI remains neutral, indicating uncertainty, while the MACD lines have crossed bearishly, with the histogram ticking lower, pointing to potential further downside.
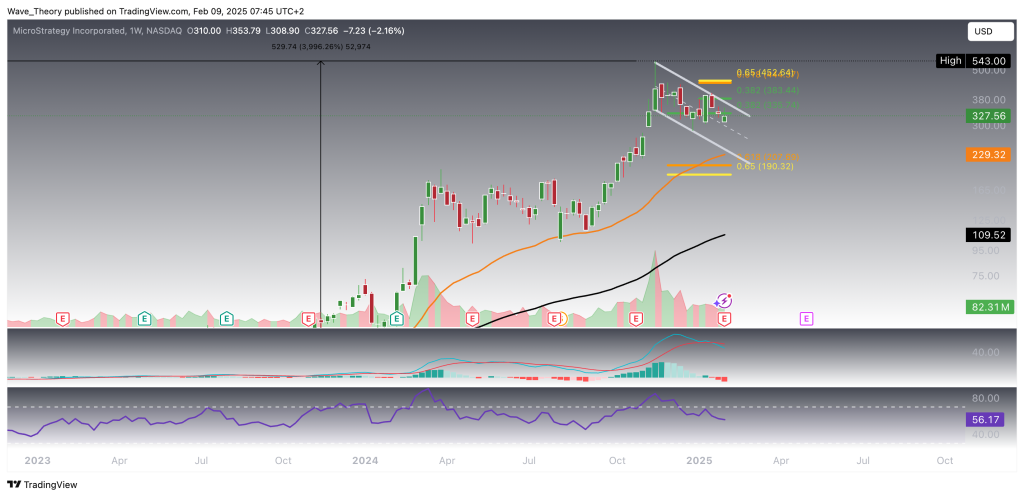
On the weekly chart, the MACD histogram has been ticking bearishly lower for the past three weeks, with the MACD lines crossed bearishly, suggesting a continued downward trajectory. While the RSI is oscillating in neutral regions, indicating a lack of immediate momentum, the EMAs still display a golden crossover, confirming a bullish trend in the mid-term.
Despite the longer-term bullish sentiment, the short- to medium-term outlook remains bearish. MicroStrategy (MSTR) is likely to extend its correction phase, with additional support found at the 50-week EMA level of $229. This level could play a crucial role in determining whether the stock will stabilize or continue its decline.
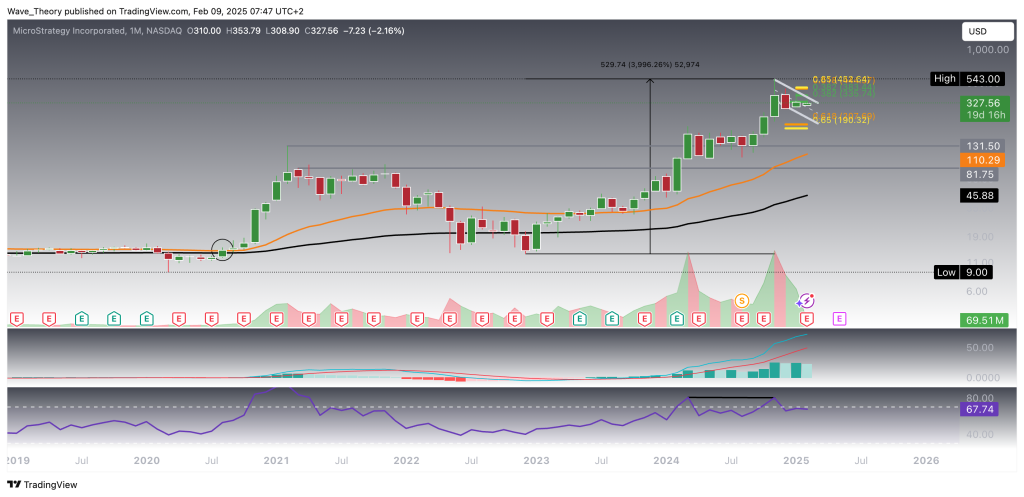
MicroStategy Enters A Correction After Monthly RSI Bearish Divergence
MicroStrategy (MSTR) has recently faced a significant correction after forming a bearish divergence on the monthly RSI. This bearish signal marks the beginning of a downward trend, supported by the MACD histogram, which has started ticking bearishly lower this month. Despite the correction, the stock has surged by nearly 4,000% in just over two years, underscoring its remarkable long-term performance. The EMAs and MACD lines remain bullishly crossed, confirming that the long-term outlook for MicroStrategy remains bullish.
However, in the short- to medium-term, the stock is expected to face further downside as it navigates through its correction phase. On the 4-hour chart, the stock faces rejection at the 50-EMA, while on the weekly chart, bearish MACD signals further support this short-term negative bias.
Key support levels include $335 and the 200-4H-EMA at $301.8, with significant long-term support at the 50-week EMA of $229. If the stock breaks the critical Fibonacci support at $190, the uptrend could be invalidated, potentially signaling a shift into a bear trend.
- Check out our free forex signals
- Follow the top economic events on FX Leaders economic calendar
- Trade better, discover more Forex Trading Strategies
- Open a FREE Trading Account
Related Articles


Comments
Sidebar rates
Related Posts
