Shiba Inu and Pepe Coin Price Charts Suggest A 300% Return Soon!
Pepe coin and Shiba Inu have lost 2/3rds of their value since December, so a 300 gain is well in the cards soon, once the crypto retreat end
Live SHIB/USD Chart

Pepe coin and Shiba Inu have lost 2/3rds of their value since December, so a 300 gain is well in the cards soon, once the crypto retreat ends.
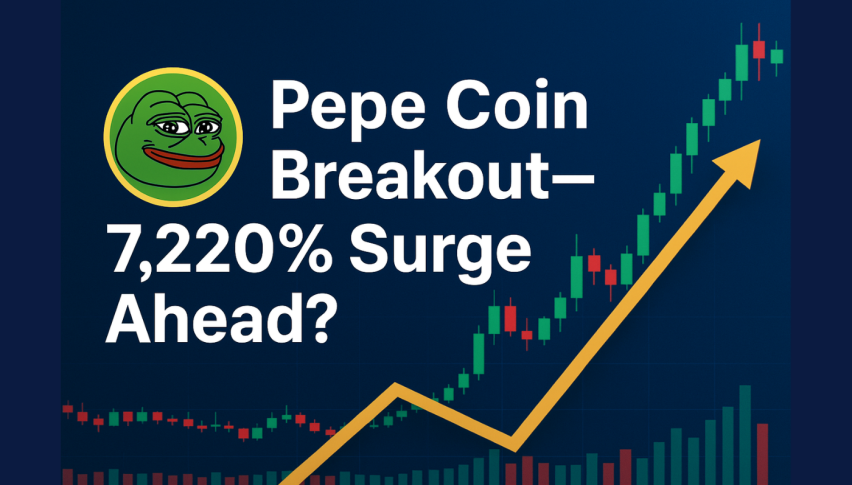
Pepe Coin has been in a steady downtrend for nearly two months, retreating from its December peak of 0.2880. The altcoin market faced intensified selling pressure in recent days as news of upcoming US tariffs spooked investors. However, with the tariffs now postponed, stock market sentiment has improved, although cryptocurrencies remain weak. Despite this weakness, yesterday’s stalled decline suggests that the downtrend may be nearing an end, potentially offering an attractive entry point for crypto buyers. This is particularly relevant for penny cryptos like Dogecoin, which have a history of rapid recoveries, sometimes posting gains of 300% or more in a short timeframe.
Pepe Coin Chart Weekly – The Elliot Wave Pattern Is Complete

Growing Institutional Interest in Dogecoin
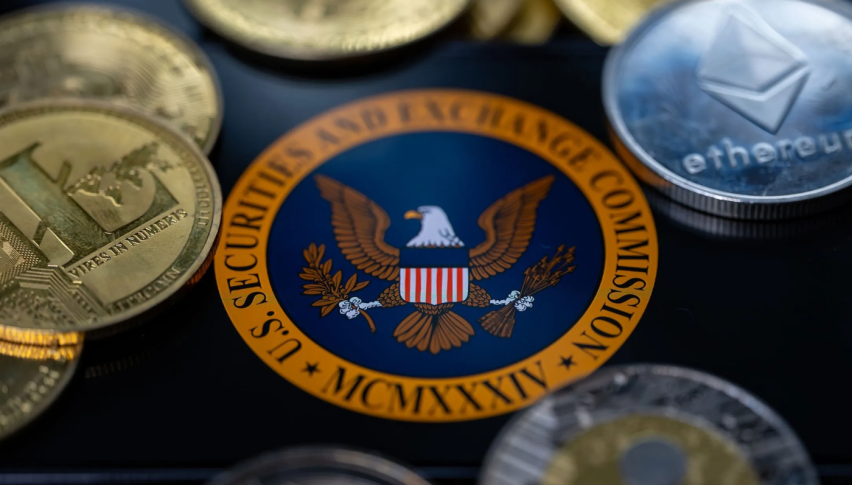
In a sign of increasing mainstream adoption, Bitwise has filed an application with the SEC to launch a Spot Dogecoin ETF. According to the S-1 filing on January 28, the Bitwise Dogecoin ETF would hold Dogecoin and actively track its market movements. The filing also names Coinbase Custody as the proposed custodian, a trusted entity in the crypto ETF space.
Beyond Bitwise, Osprey Funds and Rex Shares are also exploring Spot Dogecoin ETF offerings, adding further legitimacy to the meme coin. Market participants are watching closely, as the approval of Spot Bitcoin ETFs in the US triggered a BTC bull run in early 2024. Many traders anticipate a similar rally if a Spot Dogecoin ETF gains regulatory approval, which could serve as a major catalyst for DOGE prices.
Shiba Inu Chart – The 100 SMA Is A Good Place to Go Long
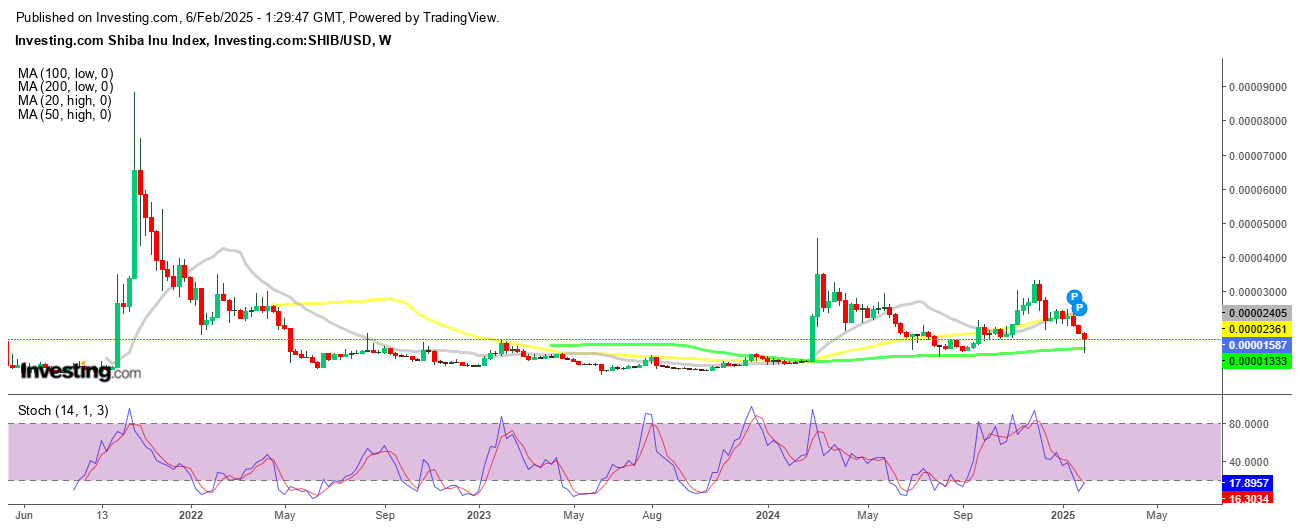
The price of Shiba Inu has also declined by around 70% since December, when it was trading at $0.000033. But, the crypto market has been in retreat since then and Shiba coin has also slipped lower. However, the 100 SMA (green)on the weekly chart stopped the sellers at $0.000012. This moving average has turned from resistance into support, holding the decline for the second time in several months, so it is a good indicator for Shiba buyers to open a buy position. However, we might not reach that level again, so we are looking for bullish reversing on the daily chart.
Shiba Inu Chart Daily – The Trendline Is Holding As Support

The Shiba Inu ecosystem has recently seen some notable developments, particularly a massive 600% spike in token burning. In just one day, approximately 3.24 million SHIB tokens were permanently removed from circulation, a trend that has caught the attention of crypto analysts, as it could influence SHIB’s price dynamics. When the supply of a token declines while demand remains strong, it increases the likelihood of price appreciation over time. For SHIB investors, this development provides a glimmer of hope amid broader market volatility, it could serve as a long-term bullish catalyst, helping to sustain Shiba Inu’s value in the face of market uncertainty.
- Check out our free forex signals
- Follow the top economic events on FX Leaders economic calendar
- Trade better, discover more Forex Trading Strategies
- Open a FREE Trading Account
Related Articles
Comments
Sidebar rates
Related Posts
