


WTI Crude Oil Dips Below $73 as US Inventories Surge by 5 Million Barrels
WTI crude oil futures fell to around $72.39 per barrel on Wednesday, marking a slight decline of 0.09%.

This drop comes as traders grapple with conflicting factors: escalating US-China trade tensions, renewed US sanctions on Iran, and a surprising surge in US crude inventories. The American Petroleum Institute (API) reported a build of 5.025 million barrels last week, significantly higher than the expected 3.17 million barrels. This unexpected rise in stockpiles signals potential oversupply, adding bearish pressure to oil prices.
Meanwhile, geopolitical tensions continue to influence the market. President Trump’s reinstated “maximum pressure” campaign aims to reduce Iran’s oil exports to zero, increasing concerns about Middle East supply stability. Conversely, China’s retaliation against US tariffs with new levies on American coal, LNG, and crude oil raises fears of dampened global demand.
OPEC+ Output Plans Add to Market Volatility
Adding to the supply-side pressures, OPEC+ confirmed its intention to gradually increase oil output starting in April. This decision reflects the group’s confidence in global demand recovery, but it also poses risks of oversupply if demand weakens amid economic slowdowns. Traders are closely monitoring how this policy shift might interact with growing US inventories and fluctuating demand forecasts.
The combination of robust US stockpiles and OPEC+’s production plans suggests that the oil market could face continued volatility. The key question remains whether demand can keep pace with increasing supply, especially given uncertainties in the global economy.
WTI Crude Oil Technical Analysis: Key Levels to Watch
WTI crude is trading within a well-defined descending channel, indicating a bearish trend. The price remains below the 50-period EMA at $72.82, reinforcing downward momentum. Immediate resistance is noted at $73.10, aligned with the EMA, serving as a dynamic barrier. A breakout above this level could challenge the next resistance at $74.72, potentially signaling a trend reversal.
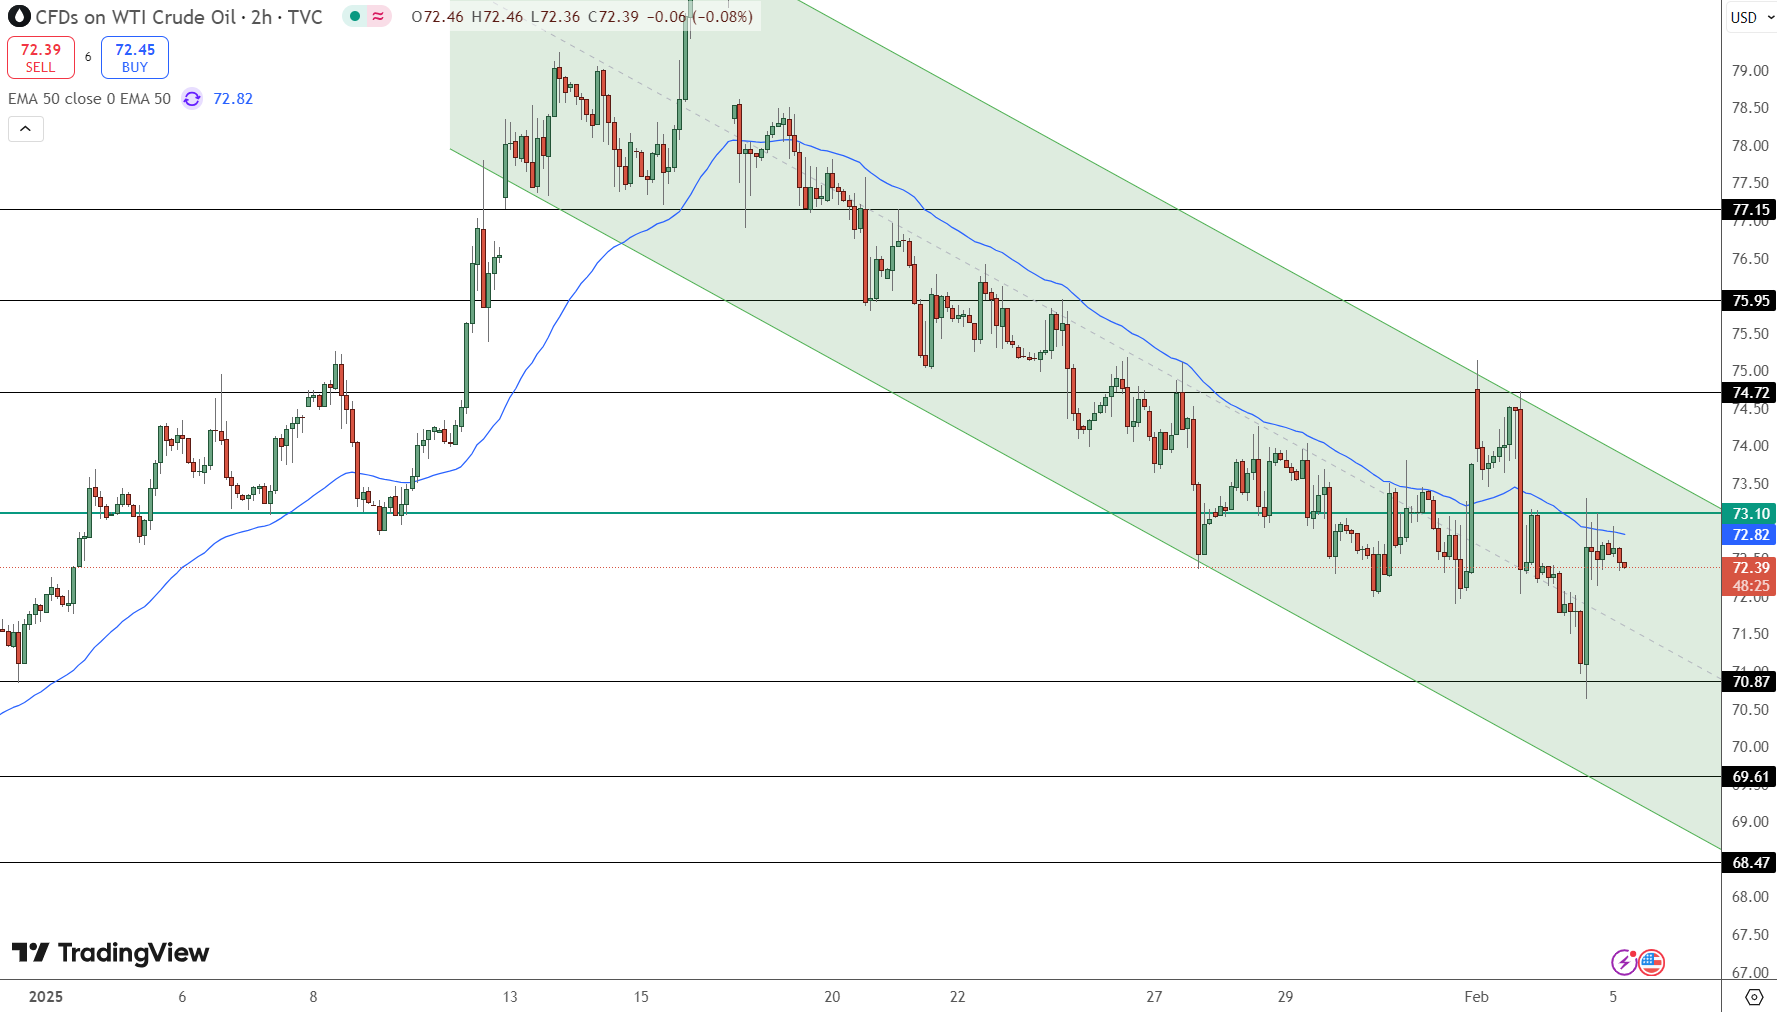
On the downside, immediate support lies at $71.87. A decisive break below this level may accelerate selling pressure, targeting $69.61 and $68.47. Key technical takeaways include:
Resistance Levels: $73.10 and $74.72
Support Levels: $71.87, $69.61, and $68.47
Trend: Bearish bias within descending channel
Traders should watch for a breakout from the channel to determine the next major move. Until then, short-term rallies are likely to face strong resistance.


Sidebar rates
Related Posts
Add 3440

