


Solana Price Analysis: Technical Signals Point to Potential $300 Target Amid Growing Adoption

Following a recent plunge below $200, Solana (SOL) is exhibiting indications of recovery; technical indicators and on-chain data point to a potential positive turnaround.
Though still 27% below its all-time high in January, the basic qualities of the cryptocurrency and rising ecosystem acceptance help to sustain its long-term future.
Solana Ecosystem’s Recent Developments
Solana’s network data show a convincing picture of ongoing expansion. Outperforming rivals including Base, Polygon, and Ethereum, which suffered reductions in activity, the platform has seen a 21% month-over-month gain in active addresses interacting with its top distributed apps (DApps).
Over 30 days, Solana DApps’ Total Value Locked (TVL) increased by 5.5%, therefore increasing the market share of the network from 6.7% in October to 9.5% now. Notable improvements in protocols including Meteora (162% increase), Binance Staked SOL (23% increase), and Marinade Finance (15% increase) have fuelled this expansion.
With $246 million in monthly fees produced by the network, it outperformed Ethereum with $133 million over the same period. Now among the top five most profitable DApps are three from the Solana ecosystem: Jito, Raydium, and Meteora.
SOL/USD Technical Analysis
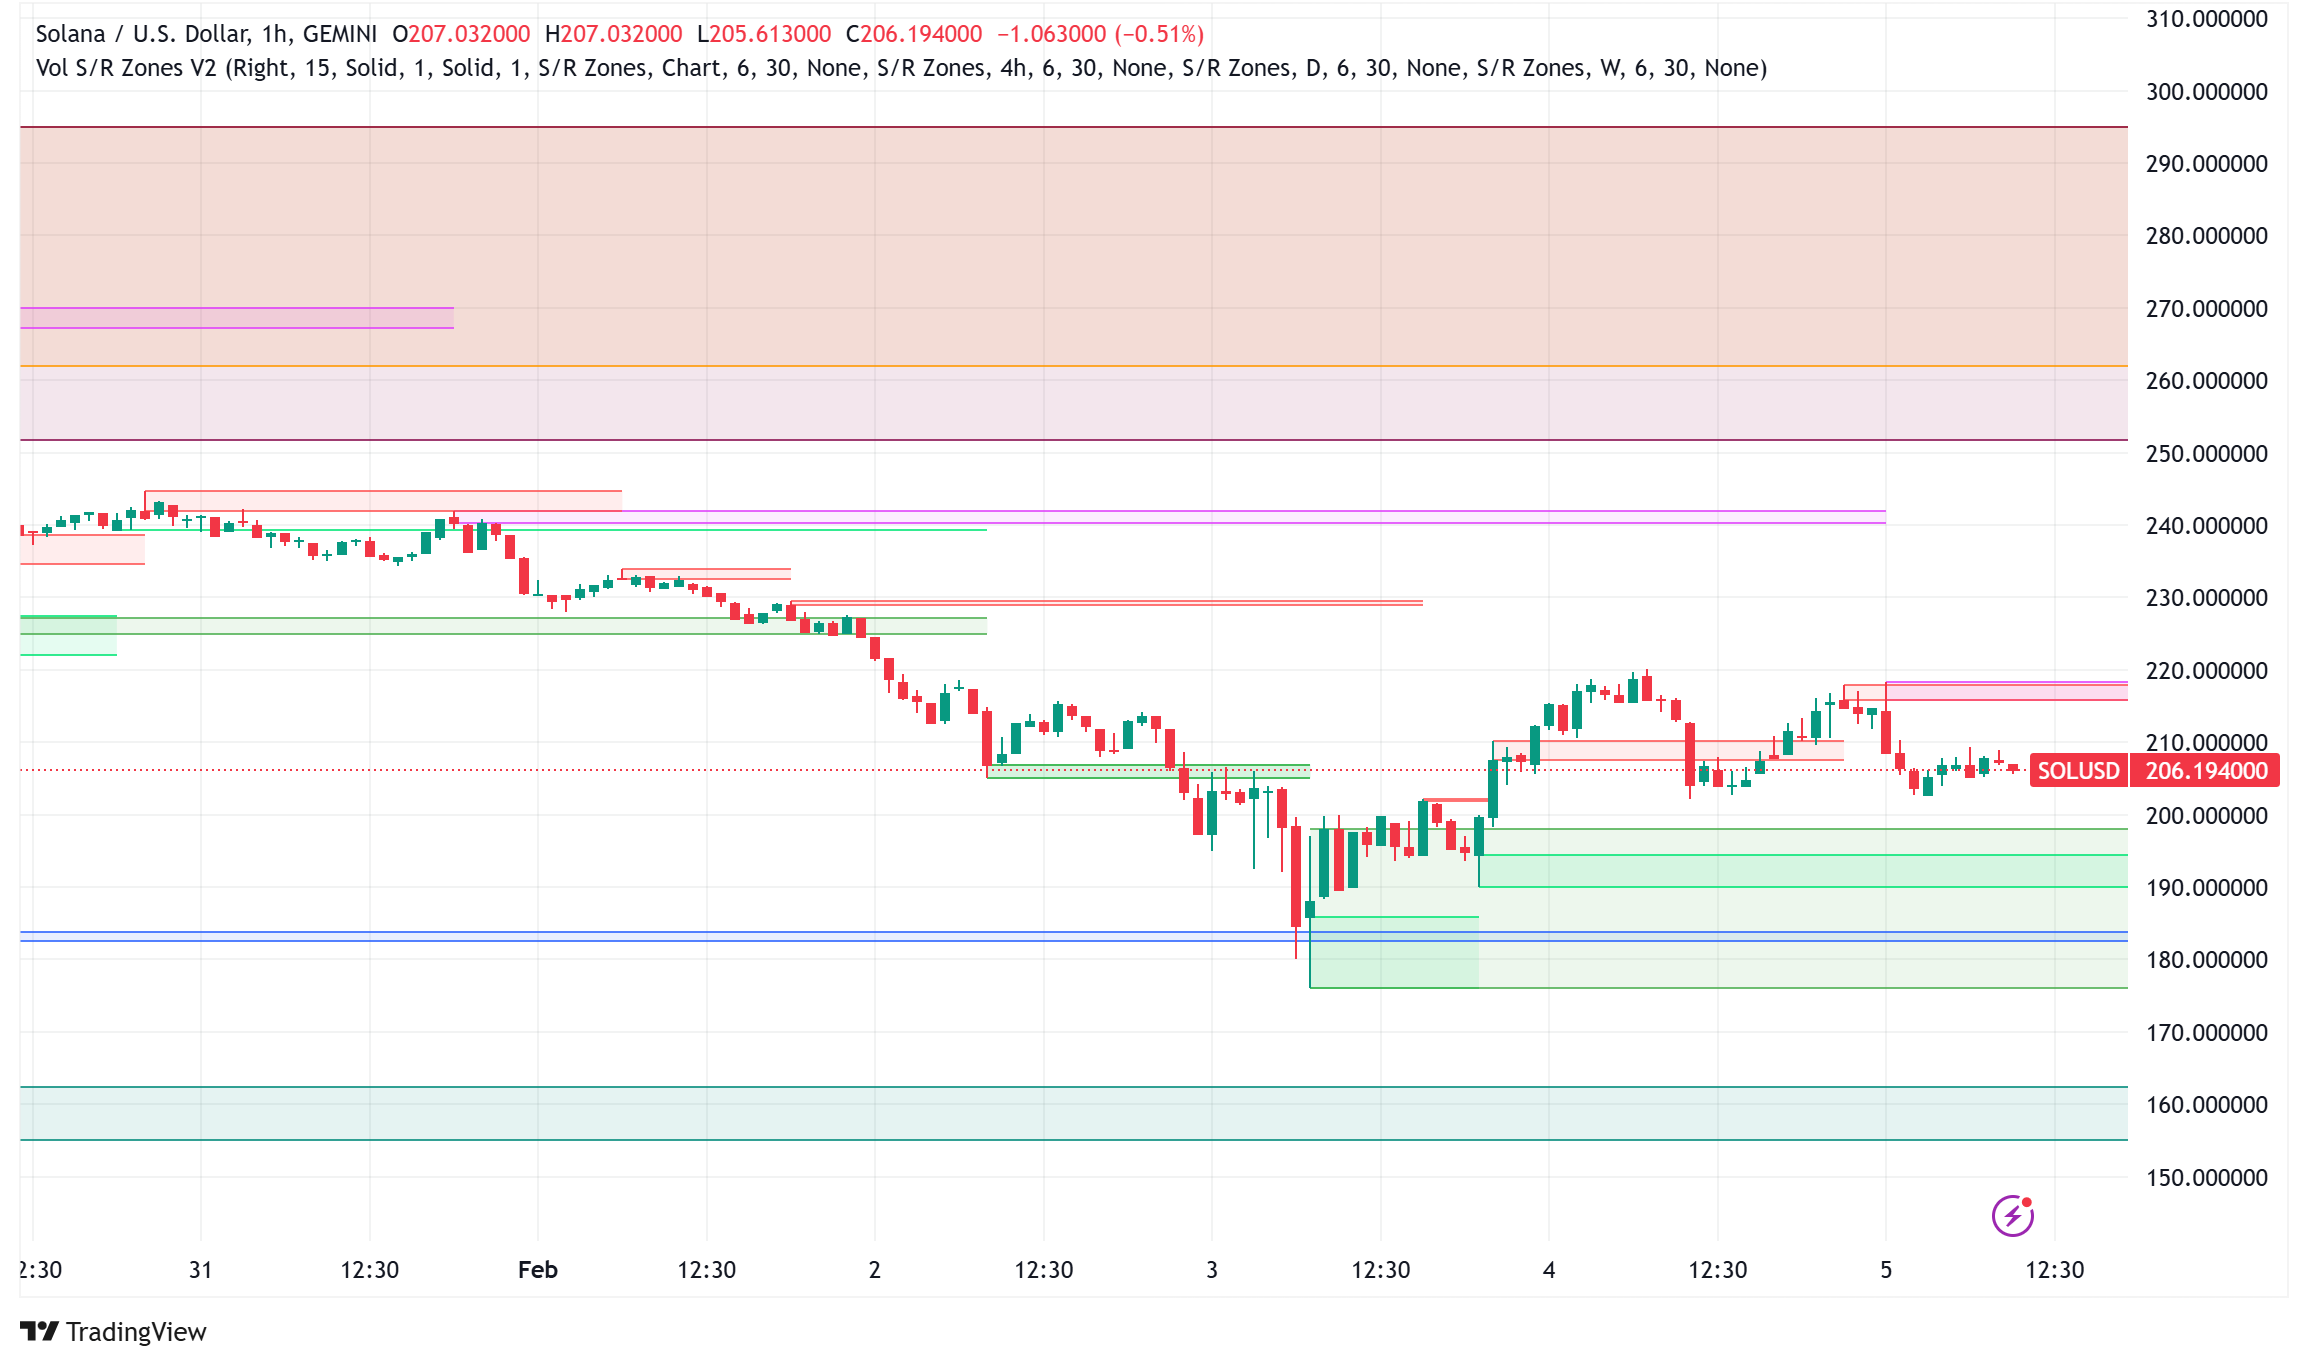
From its $180 support level tested on February 3, SOL/USD has showed an amazing 22% bounce, rising back to $215. The recovery coincides with conflicting signals from the futures market, where the monthly contracts are trading at a discount to spot prices – usually reflecting careful attitude among professional traders.
But historical evidence indicates that rather than a consistent indicator of future movements, derivatives market mood sometimes functions as a lagging indicator. Similar events in October 2023 saw SOL jump 58% following notably low levels of futures premiums, implying present market uncertainty might not fairly reflect the asset’s potential.
Elliott Wave study reveals a complicated corrective structure with SOL perhaps completing a bigger W-X-Y-X-Z pattern. At 61.37, the Relative Strength Index (RSI) exhibits positive divergence indicating declining bearish momentum without approaching overbought levels. Important resistance ranges to monitor are $246.54 (0.382 Fibonacci retracing) and $231.72 (0.5 Fibonacci retracing).
Solana Price Prediction: What’s Next for the “Visa of Crypto”?
Citing Solana’s fast throughput and cheap transaction costs as main benefits, Bank of America has already underlined Solana’s potential to become the “Visa of crypto.” Although network dependability issues still exist—some users have reported unsuccessful transactions—these scalability issues are not specific to Solana and impact several blockchain systems.
The price has to recover the $212-$220 level as support and break through resistance at $250 if SOL is to keep its positive trend. A continuous drive past $280 would prepare the ground for a possible run toward $300 in the next months. Failure to hold over $212, however, would cause a retest with reduced support levels close to $181.

Sidebar rates
Related Posts
Add 3440

