Gold and Silver Longs Keep Producing Profit Due to Lower PCE, Tariffs
Gold and Silver had another great week, with XAU printing another record high above $2,800, while XAG climbed above $31, benefiting buyers.

Live XAG/USD Chart
[[XAG/USD-graph]]
Gold and Silver had another great week, with XAU printing another record high above $2,800, while XAG climbed above $31, benefiting buyers.

Spot gold surged past the $2,800 mark on Friday, reaching a high of $2,817 after Thursday’s intraday peak of $2,798. The move was fueled by renewed concerns over U.S. tariff policies, as former President Donald Trump reiterated his intention to impose a 25% tariff on imports from Canada and Mexico. This reignited fears of escalating trade tensions, prompting investors to seek safe-haven assets.
Gold Chart Daily – Another Major Target Breached
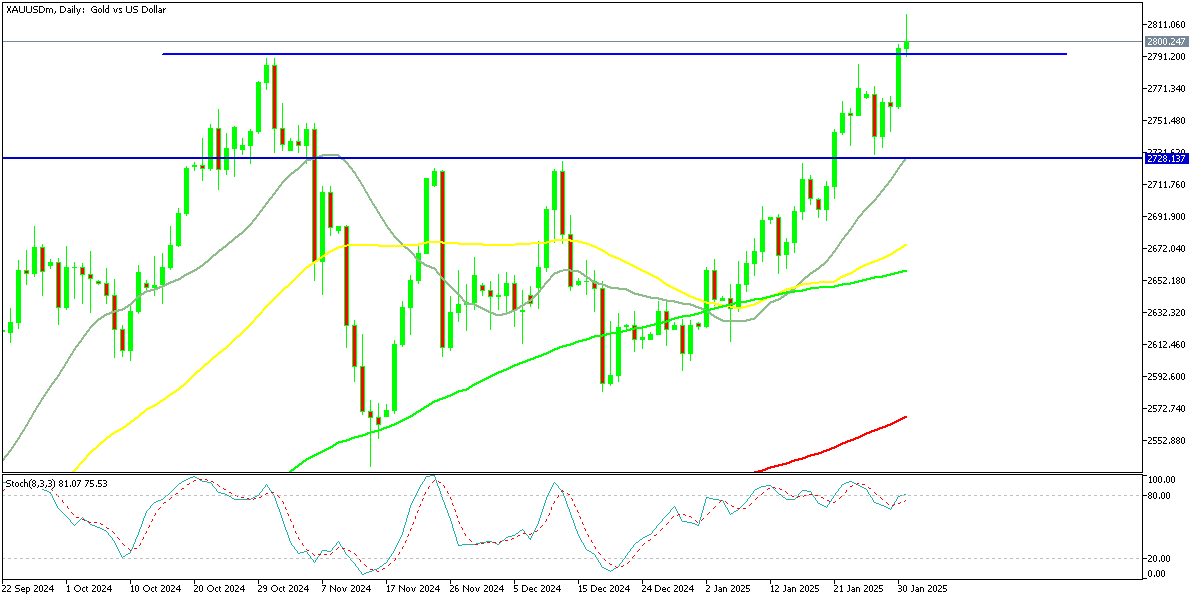
Historically, precious metals like gold and silver have thrived during periods of political and economic instability, acting as a hedge against inflation and currency fluctuations. The persistent threat of tariffs contributed to gold’s decisive break above $2,800, with investors shifting capital into the metal to mitigate market volatility. The broader risk-off sentiment has strengthened gold’s appeal, reinforcing its role as a safe-haven asset.
Rising Gold Reserves Signal Growing Demand
The surge in gold prices is further supported by increasing reserves in COMEX-approved warehouses. Since November, gold inventories have jumped by 73.5%, now totaling 30.4 million ounces. This accumulation reflects growing investor demand, suggesting that gold’s upward trajectory may continue as macroeconomic uncertainty persists. Besides that, the PCE inflation report also helped Gold earlier on Friday in the push above $2,800.
Highlights of the US December PCE Inflation Report

Core PCE (excluding food & energy):
US December PCE Data
- Core PCE (YoY): +2.8% (expected +2.8%, prior +2.8%)
- Core PCE (MoM): +0.2% (expected +0.2%)
- Unrounded Core PCE: +0.156% (prior +0.1149%)
- PCE Excluding Food, Energy, and Housing (MoM): +0.2% (prior +0.1%)
Headline PCE Data
- Headline PCE (YoY): +2.6% (expected +2.6%)
- Deflator (MoM): +0.3% (expected +0.3%)
- Unrounded Headline PCE: +0.2557% (prior +0.128%)
Consumer Spending & Income (December)
- Personal Income: +0.4% (expected +0.4%, prior +0.3%)
- Personal Spending: +0.7% (expected +0.5%, prior revised from +0.4% to +0.6%)
- Real Personal Spending: +0.4% (prior +0.3%)
- Savings Rate: 3.8% (prior 4.4%)
US Employment Cost Index (Q4 2024)
- Quarterly Employment Costs: +0.9% (expected +0.9%, prior +0.8%)
- Employment Cost Index (YoY): +3.8% (prior quarter +3.9%)
- Benefits Cost: +0.8% (prior +0.8%)
- YoY Benefits Increase: +3.6% (2024) vs. +3.8% (2023)
- Wages Growth: +0.9% (prior +0.8%)
- YoY Wage Growth: +3.8% (2024) vs. +4.3% (2023)
The unrounded core PCE number almost made it to +0.1% but overall these numbers are in-line with estimates. The other standout is the strength in the consumer, which also isn’t a big surprise given the high consumption reading in Thursday’s GDP report.
Gold Live Chart
- Check out our free forex signals
- Follow the top economic events on FX Leaders economic calendar
- Trade better, discover more Forex Trading Strategies
- Open a FREE Trading Account
Related Articles

Comments
Sidebar rates
Related Posts
