Robinhood (HOOD) Set to Reach Bullish Target of $57, But Could Face Short-Term Rejection
Back in October, we anticipated Robinhood’s bullish trajectory and set a target of $57, which the stock is now on the verge of reaching. As Robinhood approaches this critical level, what happens next will depend on whether it can break through this resistance and maintain upward momentum.
Robinhood (HOOD) Soars Over 122% Following Our Initial Bullish Call
| Broker | Review | Regulators | Min Deposit | Website | |
|---|---|---|---|---|---|
| 🥇 |  | Read Review | FCA, CySEC, ASIC, MAS, FSA, EFSA, DFSA, CFTC | USD 100 | Visit Broker |
| 🥈 | Read Review | FSCA, FSC, ASIC, CySEC, DFSA | USD 5 | Visit Broker | |
| 🥉 |  | Read Review | CySEC, MISA, FSCA | USD 25 | Visit Broker |
| 4 |  | Read Review | ASIC, BaFin, CMA, CySEC, DFSA, FCA, SCB | USD 200 | Visit Broker |
| 5 |  | Read Review | ASIC, FCA, CySEC, SCB | USD 100 | Visit Broker |
| 6 | Read Review | FCA, FSCA, FSC, CMA | USD 200 | Visit Broker | |
| 7 | Read Review | BVI FSC | USD 1 | Visit Broker | |
| 8 |  | Read Review | CBCS, CySEC, FCA, FSA, FSC, FSCA, CMA | USD 10 | Visit Broker |
| 9 |  | Read Review | ASIC, CySEC, FSCA, CMA | USD 100 | Visit Broker |
| 10 |  | Read Review | IFSC, FSCA, ASIC, CySEC | USD 1 | Visit Broker |
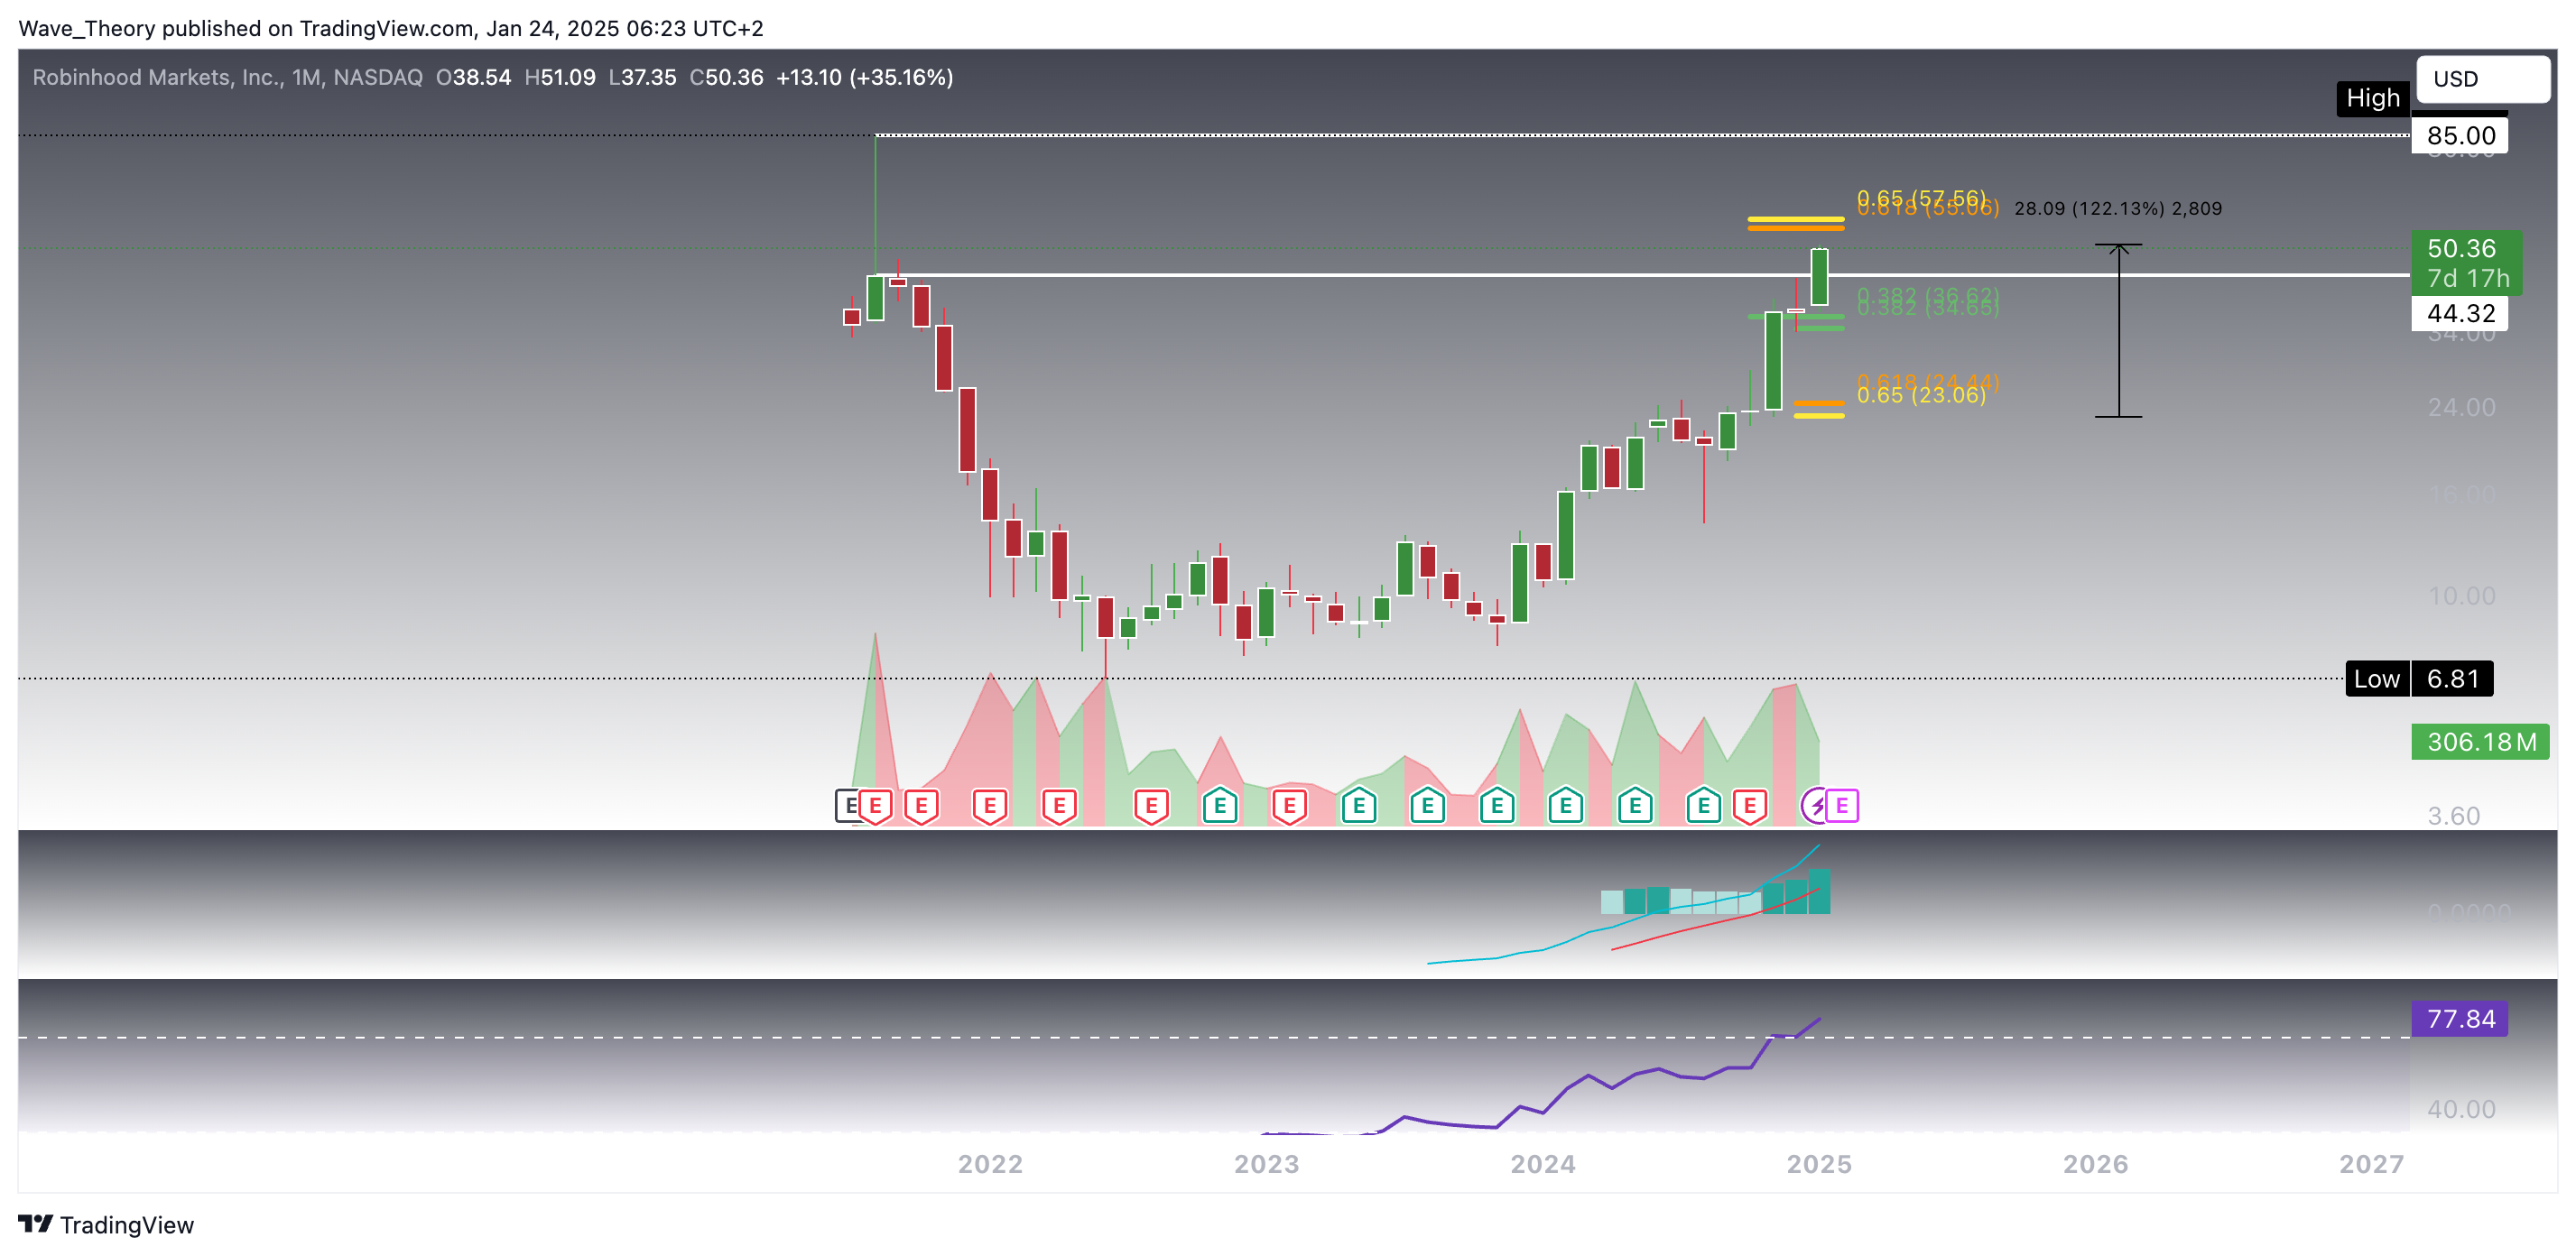
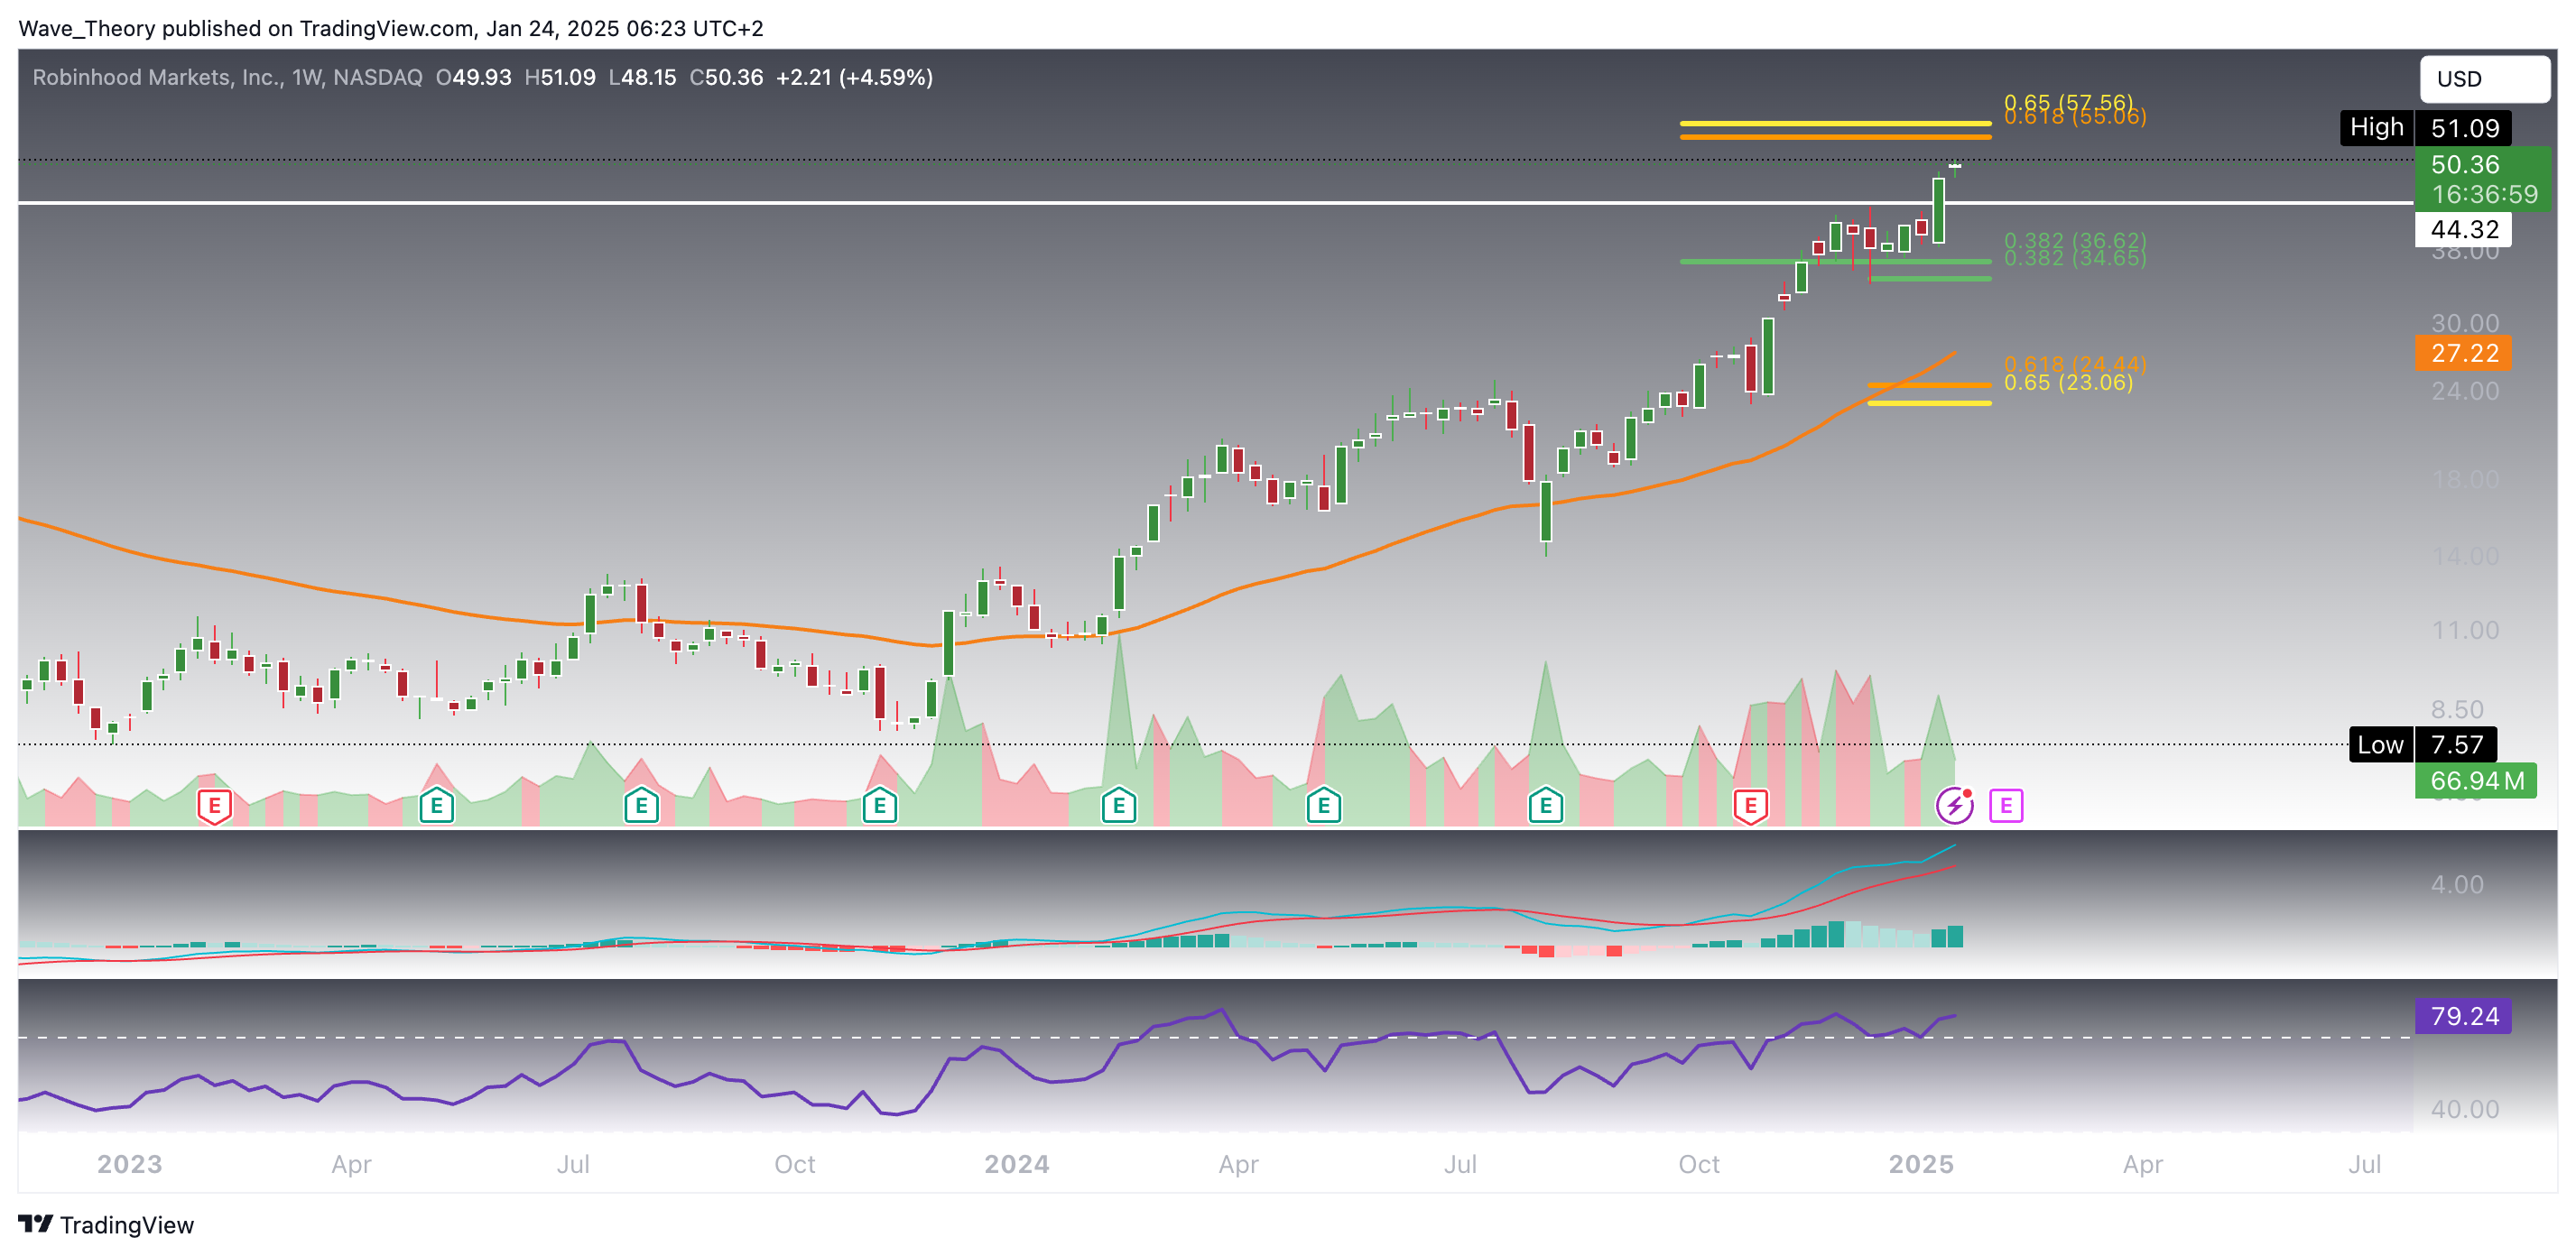
Weekly Chart Confirms Strong Bullish Momentum for Robinhood (HOOD)
On the weekly chart, Robinhood’s stock maintains a strong bullish outlook. The MACD lines have crossed bullishly, and the histogram continues to tick higher since last week, reinforcing the upward momentum. However, there is a potential risk of a bearish divergence forming in the RSI, which could signal weakening momentum. This divergence may coincide with the stock reaching the golden ratio resistance around $57, suggesting that Robinhood could face a short-term rejection and initiate a correction.
In the event of a pullback, the stock finds its next major Fibonacci support levels at $35 and $24. Additionally, the 50-week EMA, currently around $27, acts as a dynamic support level that could cushion any downside movement. These support zones provide strong levels for a potential bounce, keeping the overall bullish trend intact despite possible short-term corrections. Traders should closely monitor these levels for signs of consolidation or reversal.
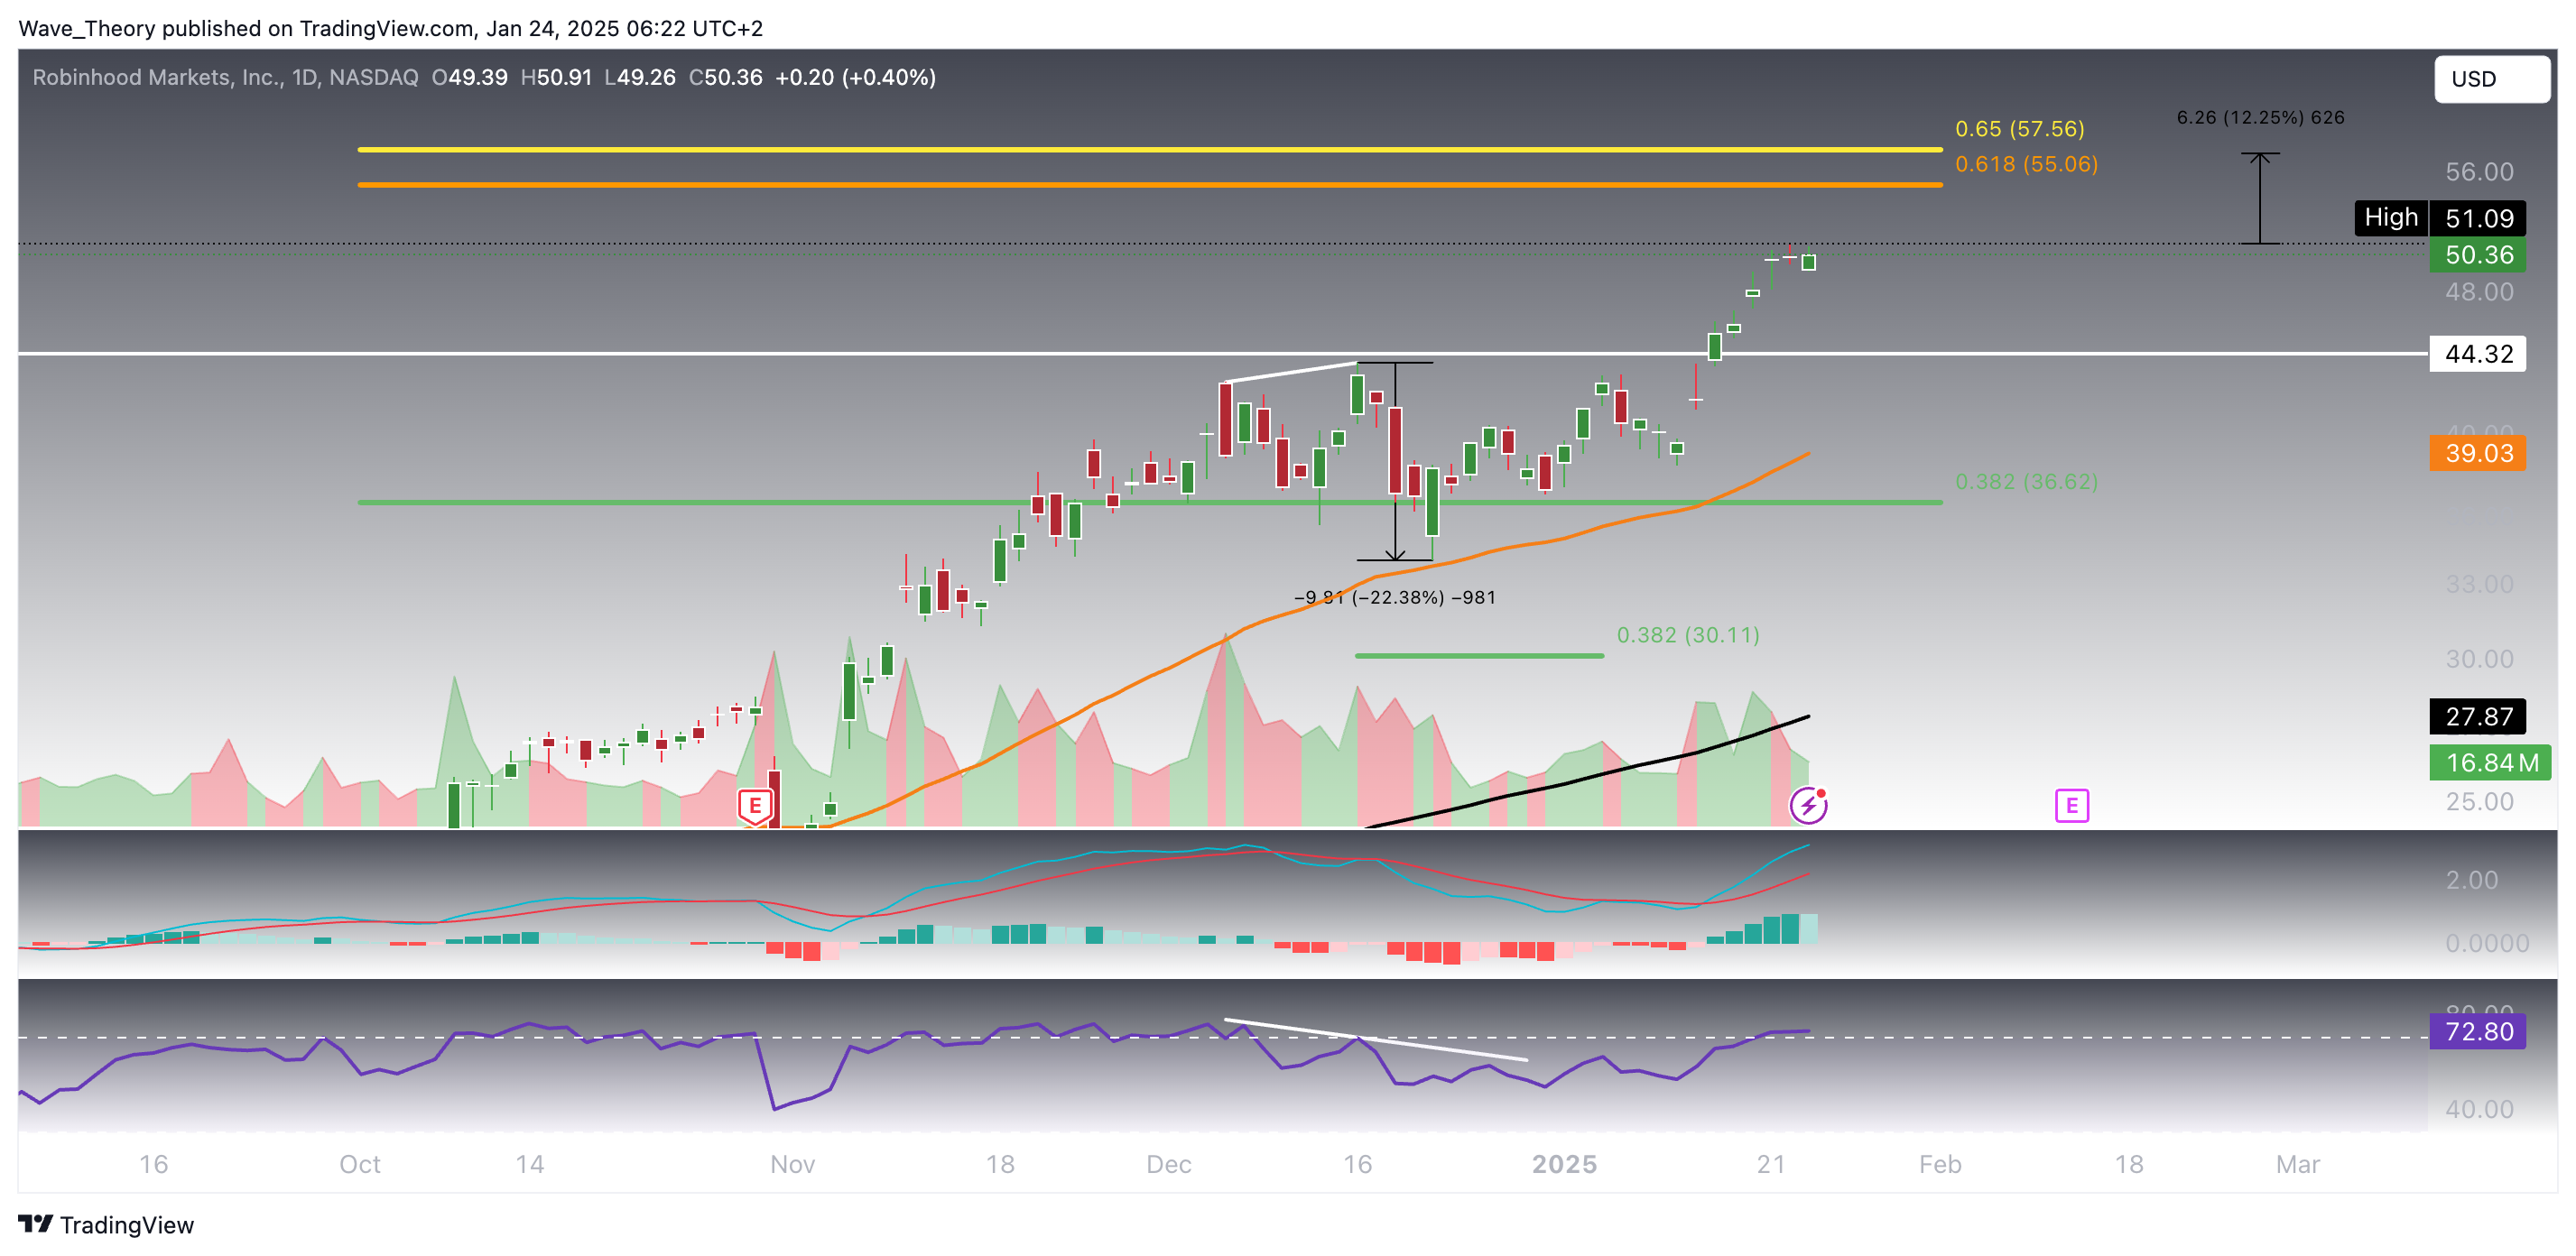
Robinhood (HOOD) Faced a 22.4% Correction After Bearish Divergence
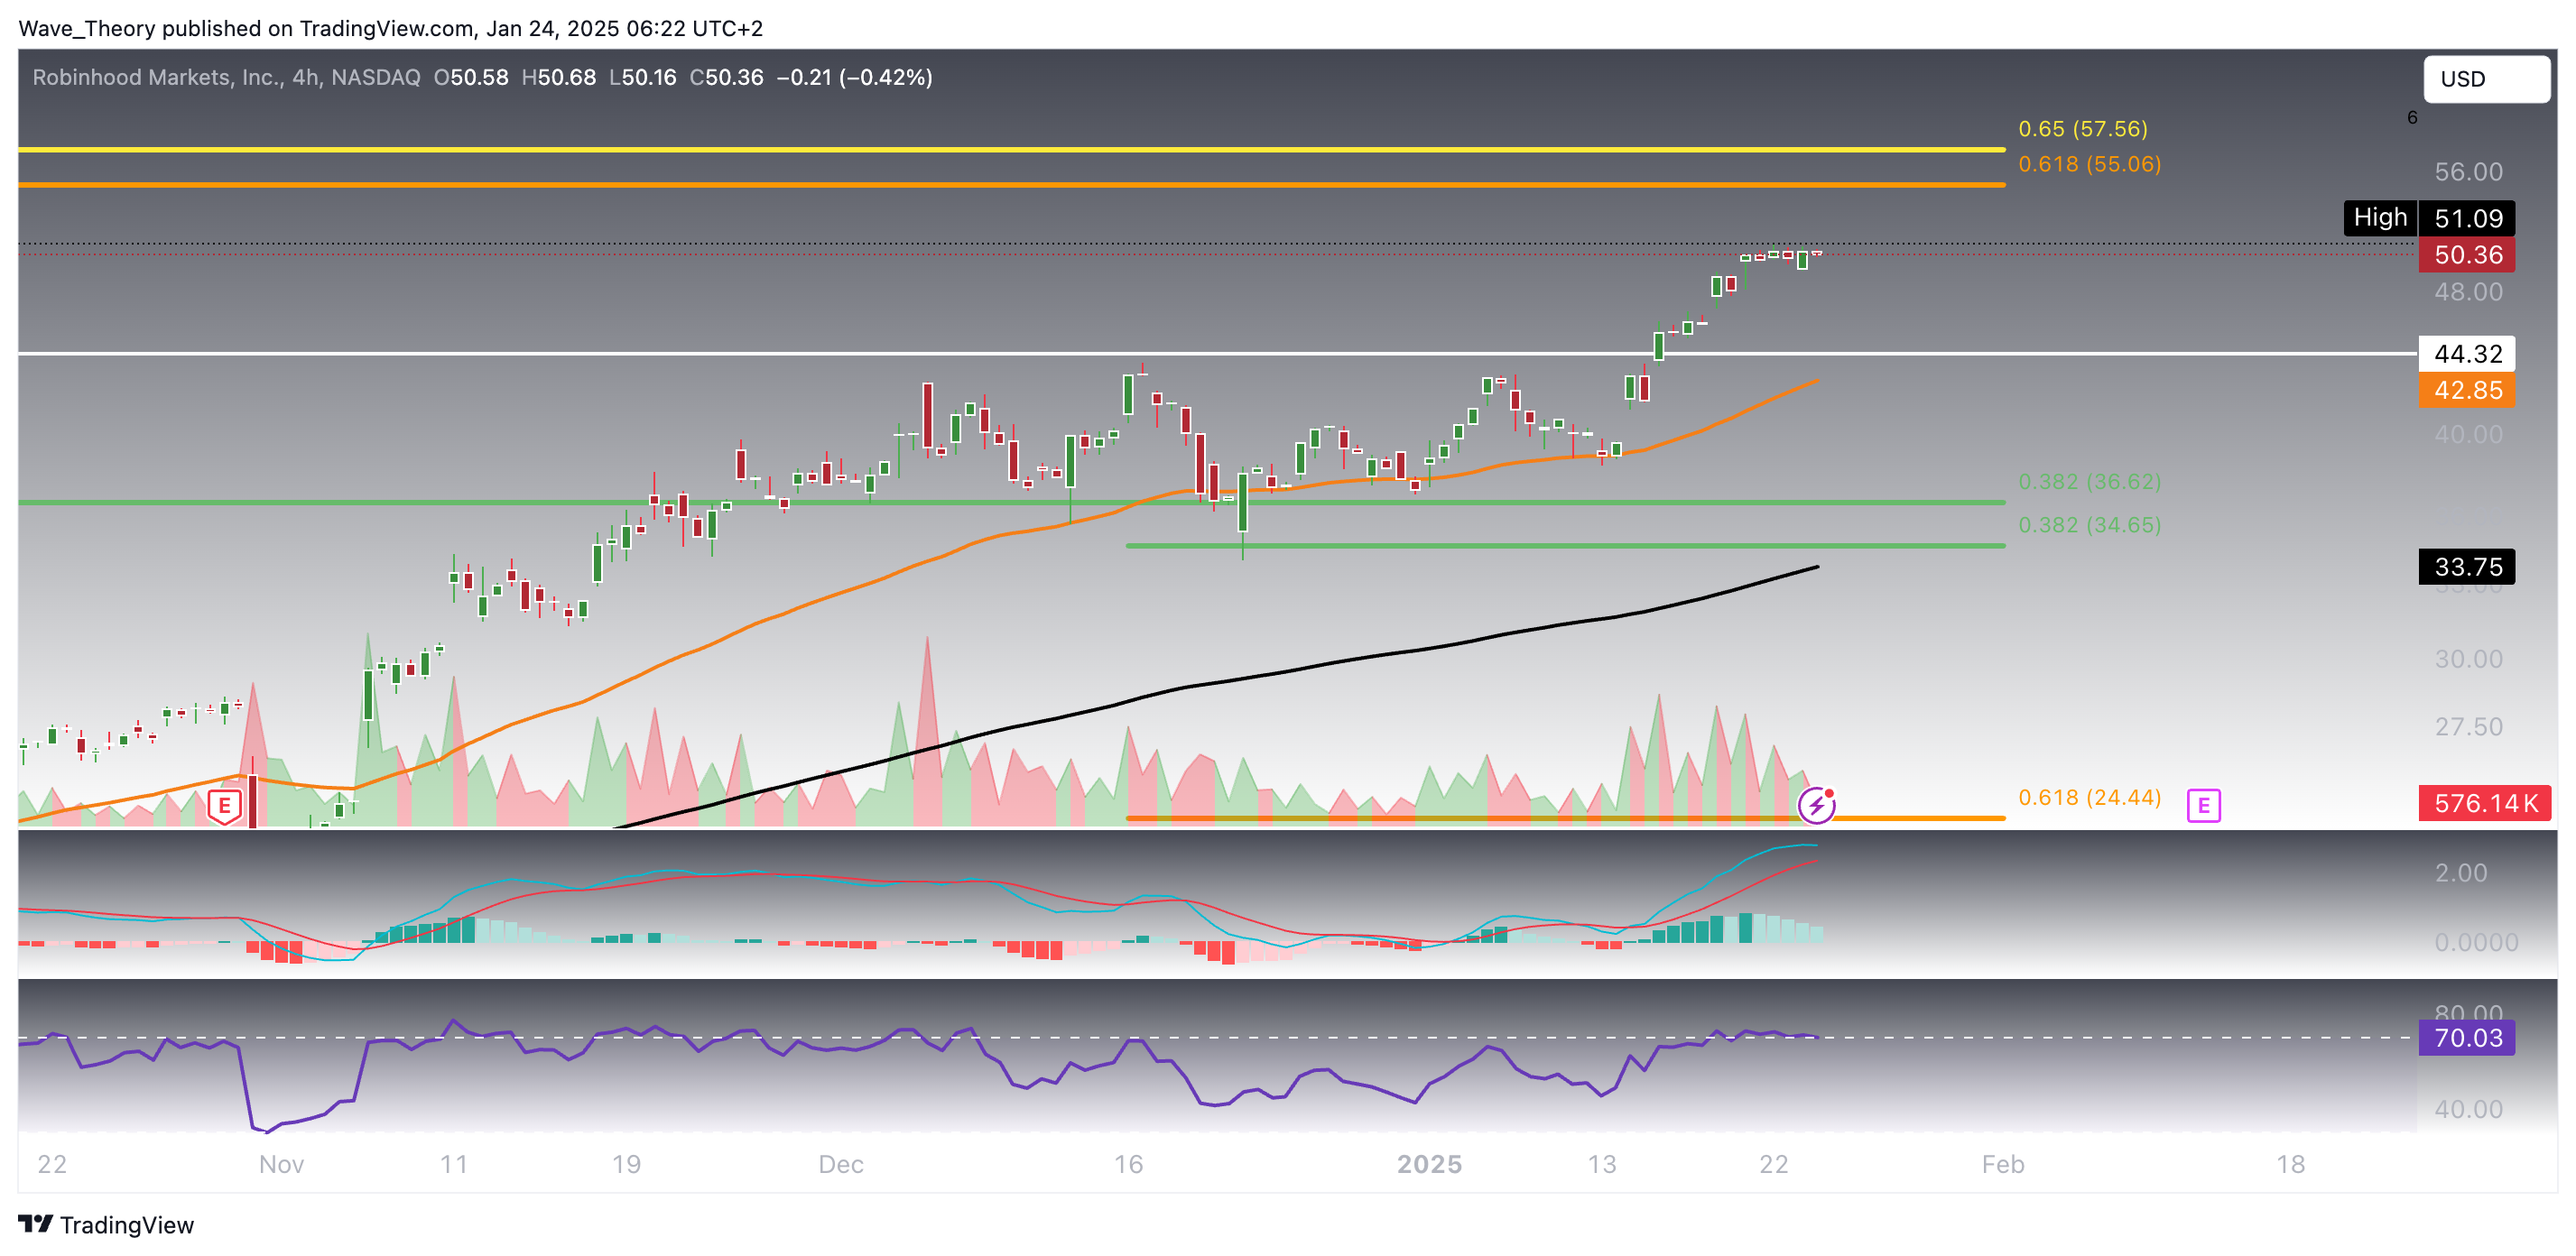
On the 4-hour chart, Robinhood’s stock presents a mixed technical picture. The EMAs continue to display a golden crossover, confirming the bullish trend in the short term. Additionally, the RSI is nearing overbought levels, though it has yet to show any clear bearish signals.
However, caution is warranted, as the MACD lines appear on the verge of crossing bearishly. The MACD histogram has been ticking lower for the past few hours, suggesting a potential weakening of momentum. While the overall trend remains bullish, short-term traders should be mindful of these developments, as a bearish MACD crossover could lead to a minor pullback or consolidation in the near term.


Add 3442

Related Posts
Add 3440