GameStop (GME) Ready for a Rebound After Steep Correction?

GameStop (GME) has undergone a sharp correction over the past few days, falling from $34.4 to $26.33, marking a significant pullback. Despite this decline, a potential rebound may be on the horizon.
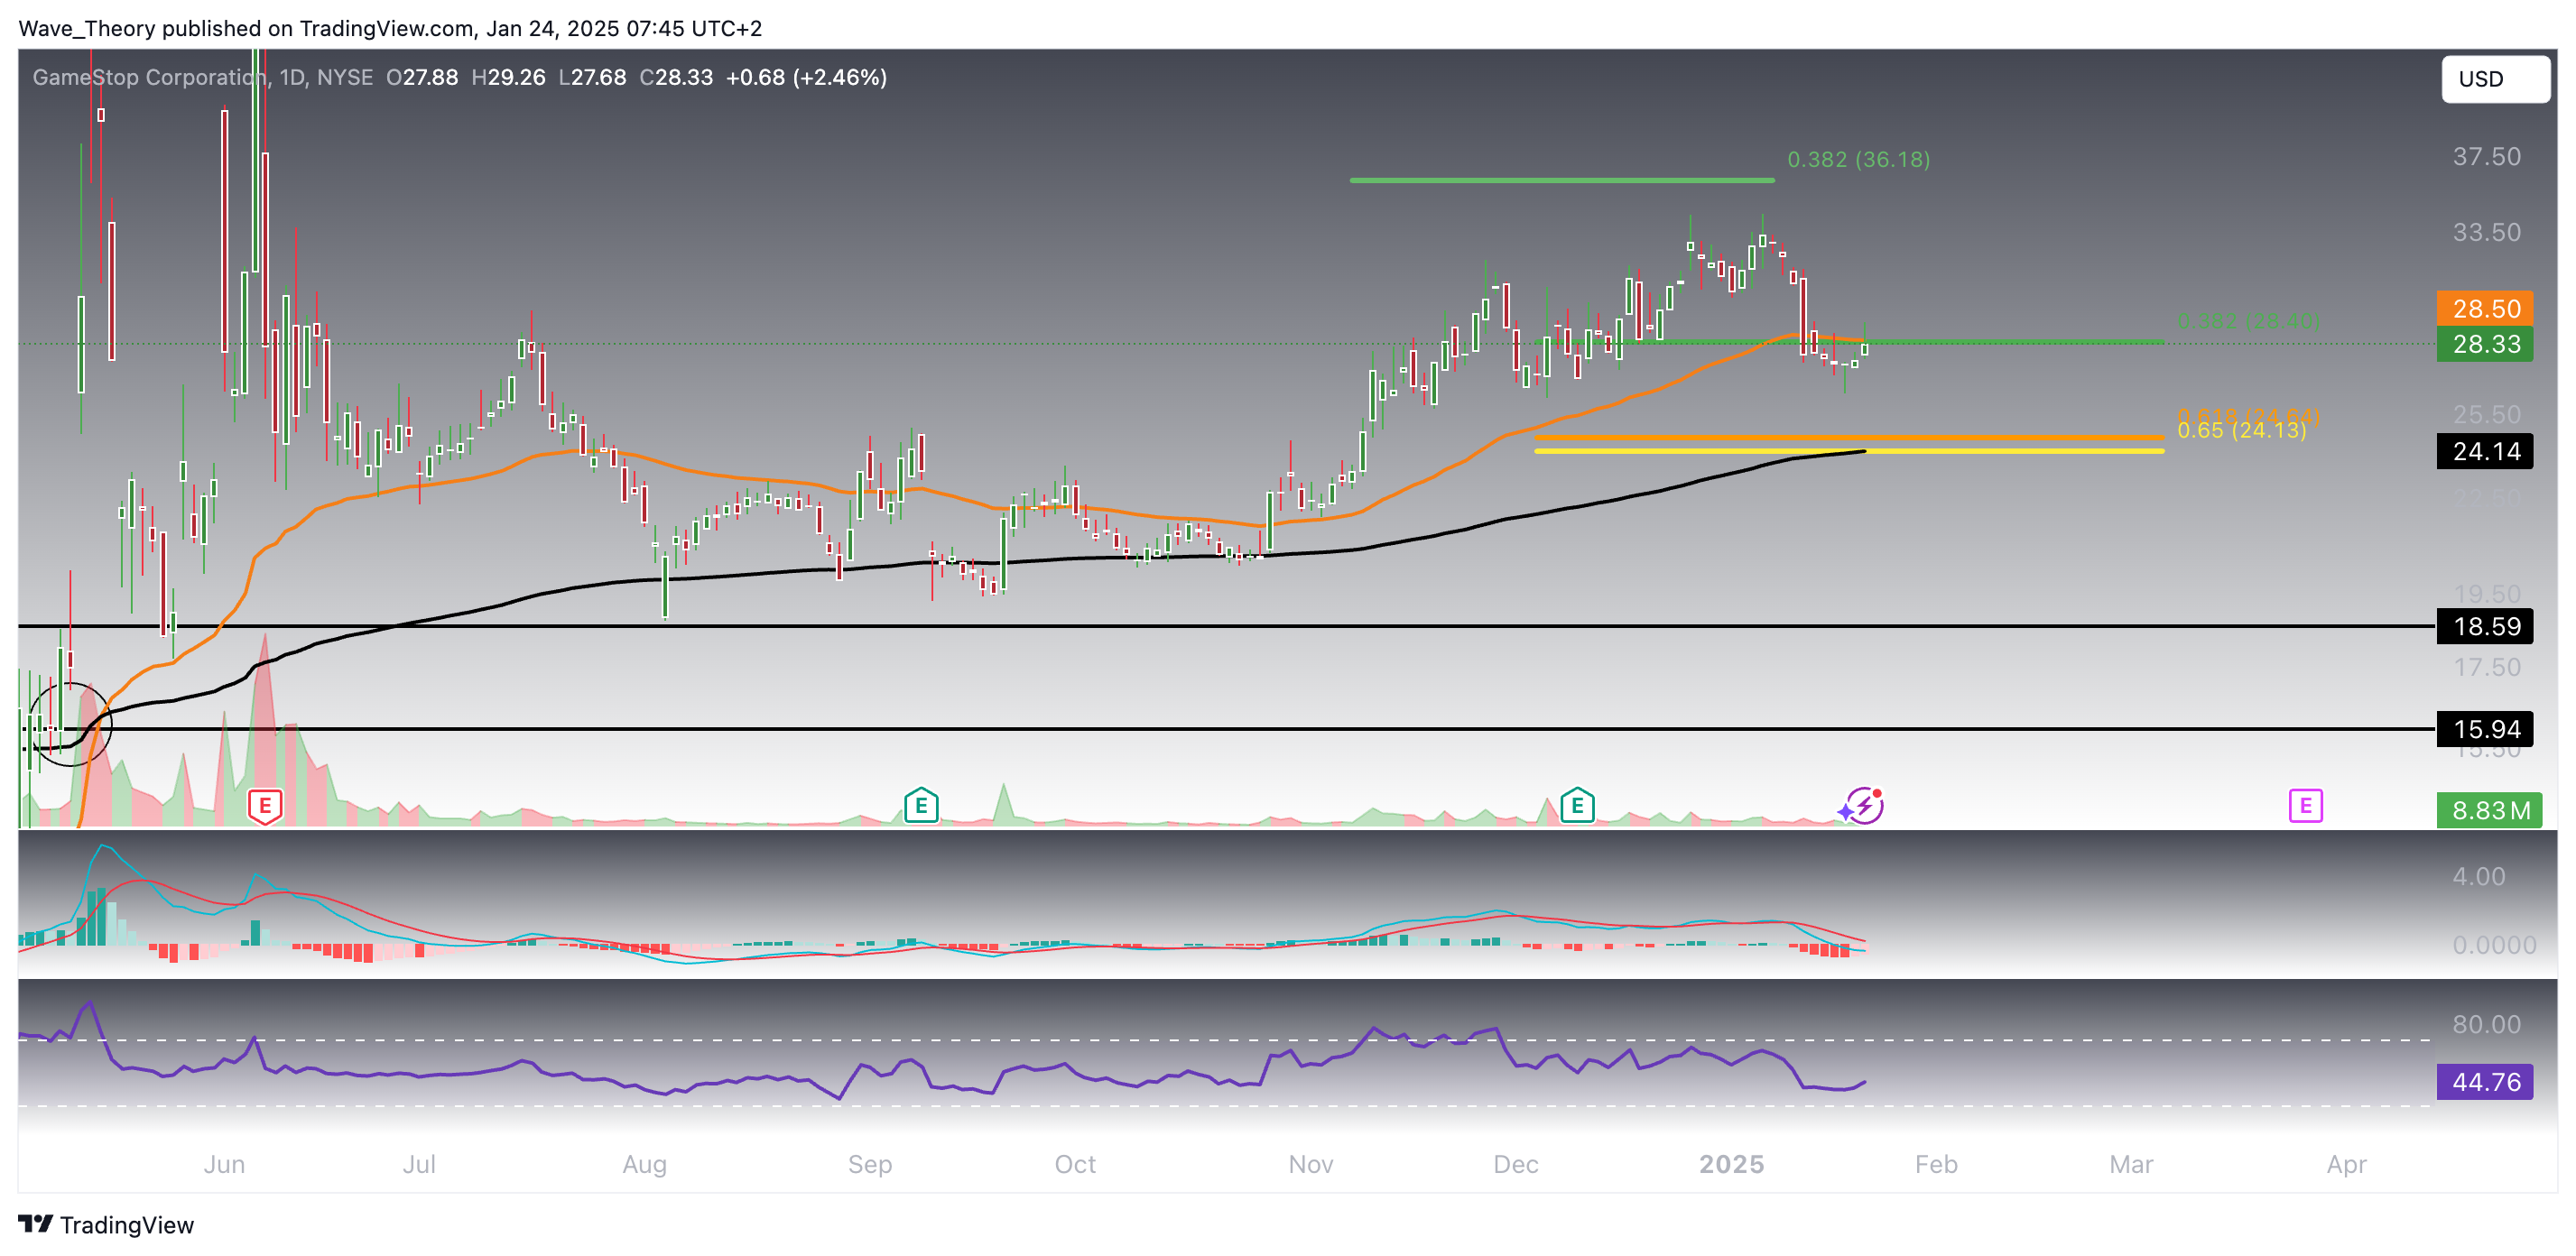
GameStop (GME) Stock: Potential Further Decline Towards Golden Ratio Support
The GME stock has recently broken below the 0.382 Fibonacci support and the 50-day EMA at $28.4, signaling a bearish move. This could lead to a further correction, with the next target being the golden ratio support at $24, where the 200-day EMA provides additional reinforcement. At this level, GME could potentially see a bullish bounce, aiming to retest the Fibonacci resistance at $36.
Key Technical Indicators (Daily Chart)
- MACD: The MACD lines remain bearishly crossed, though today’s bullish uptick in the MACD histogram hints at a possible trend reversal.
- RSI: The RSI is neutral, indicating that the stock is neither overbought nor oversold, leaving room for potential price appreciation.
- EMAs: The golden cross of the EMAs suggests that, despite the current correction, the short- to mid-term bullish trend remains intact.
After a Bullish Bounce: Does GME Now Face Rejection?
On the 4-hour chart, GME recently bounced off the 200-4H-EMA support at $26.5 and rallied towards the 50-4H-EMA at $29.4, where it currently appears to be facing rejection. These two levels are critical for determining the stock’s next move.
If the 50-4H-EMA resistance breaks, GME could potentially surge towards the 0.382 Fibonacci resistance at $36. On the other hand, a break below the 200-4H-EMA could lead to a further decline, with the golden ratio support at $24 as the next major target.
Technical indicators show a rather bullish outlook:
- MACD: The MACD lines are on the verge of crossing bullishly, while the histogram is trending upward, indicating growing bullish momentum.
- EMAs: The golden crossover of the EMAs remains intact, confirming a short-term bullish trend.
- RSI: The RSI is moving in neutral territory, showing no strong signals in either direction.
Traders should keep a close eye on these key support and resistance levels to gauge GME’s next move.

GameStop
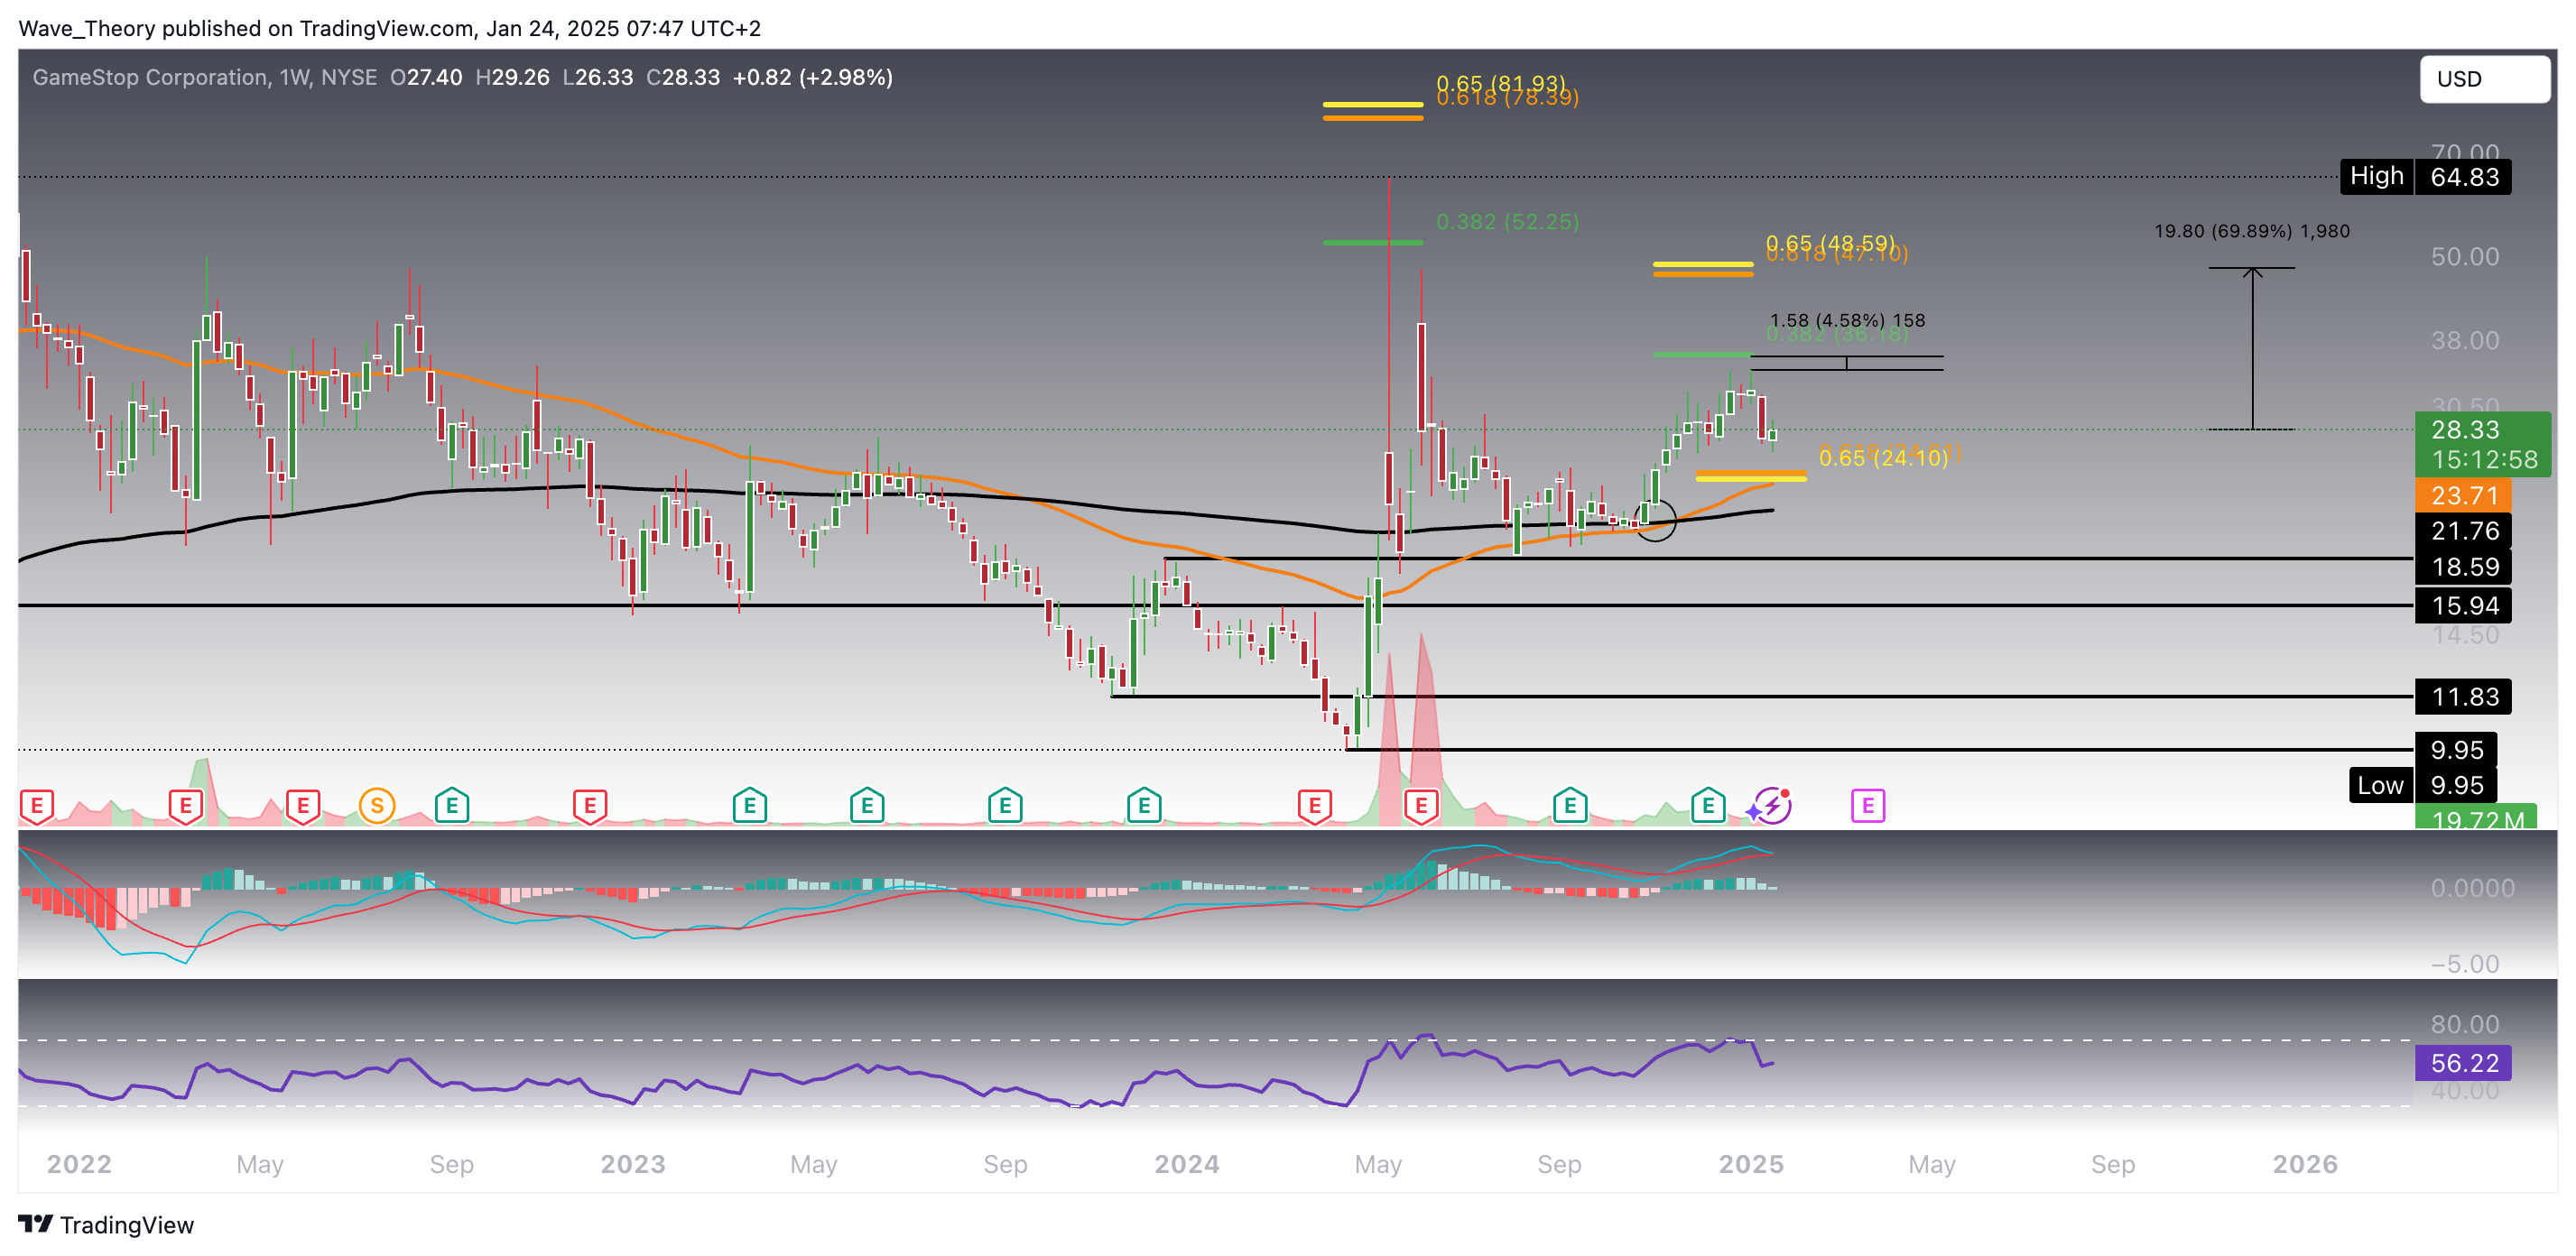
A Golden Crossover Has Emerged On The Weekly Chart
On the weekly chart, a golden crossover of the EMAs has emerged, confirming a bullish trend in the mid-term. However, this is contrasted by the MACD, which is on the verge of a bearish crossover, as the MACD histogram has been ticking lower for four consecutive weeks. Meanwhile, the RSI remains neutral, offering no clear overbought or oversold signals.
GameStop recently came within 4.6% of the 0.382 Fibonacci resistance at $36. If this resistance is broken bullishly, the stock could surge by up to 70% from its current price, with the next major resistance level at the golden ratio of $48. On the downside, should GME continue its correction, the golden ratio support between $24 and $25 could present an ideal entry point for bulls looking to capitalize on a potential rebound.
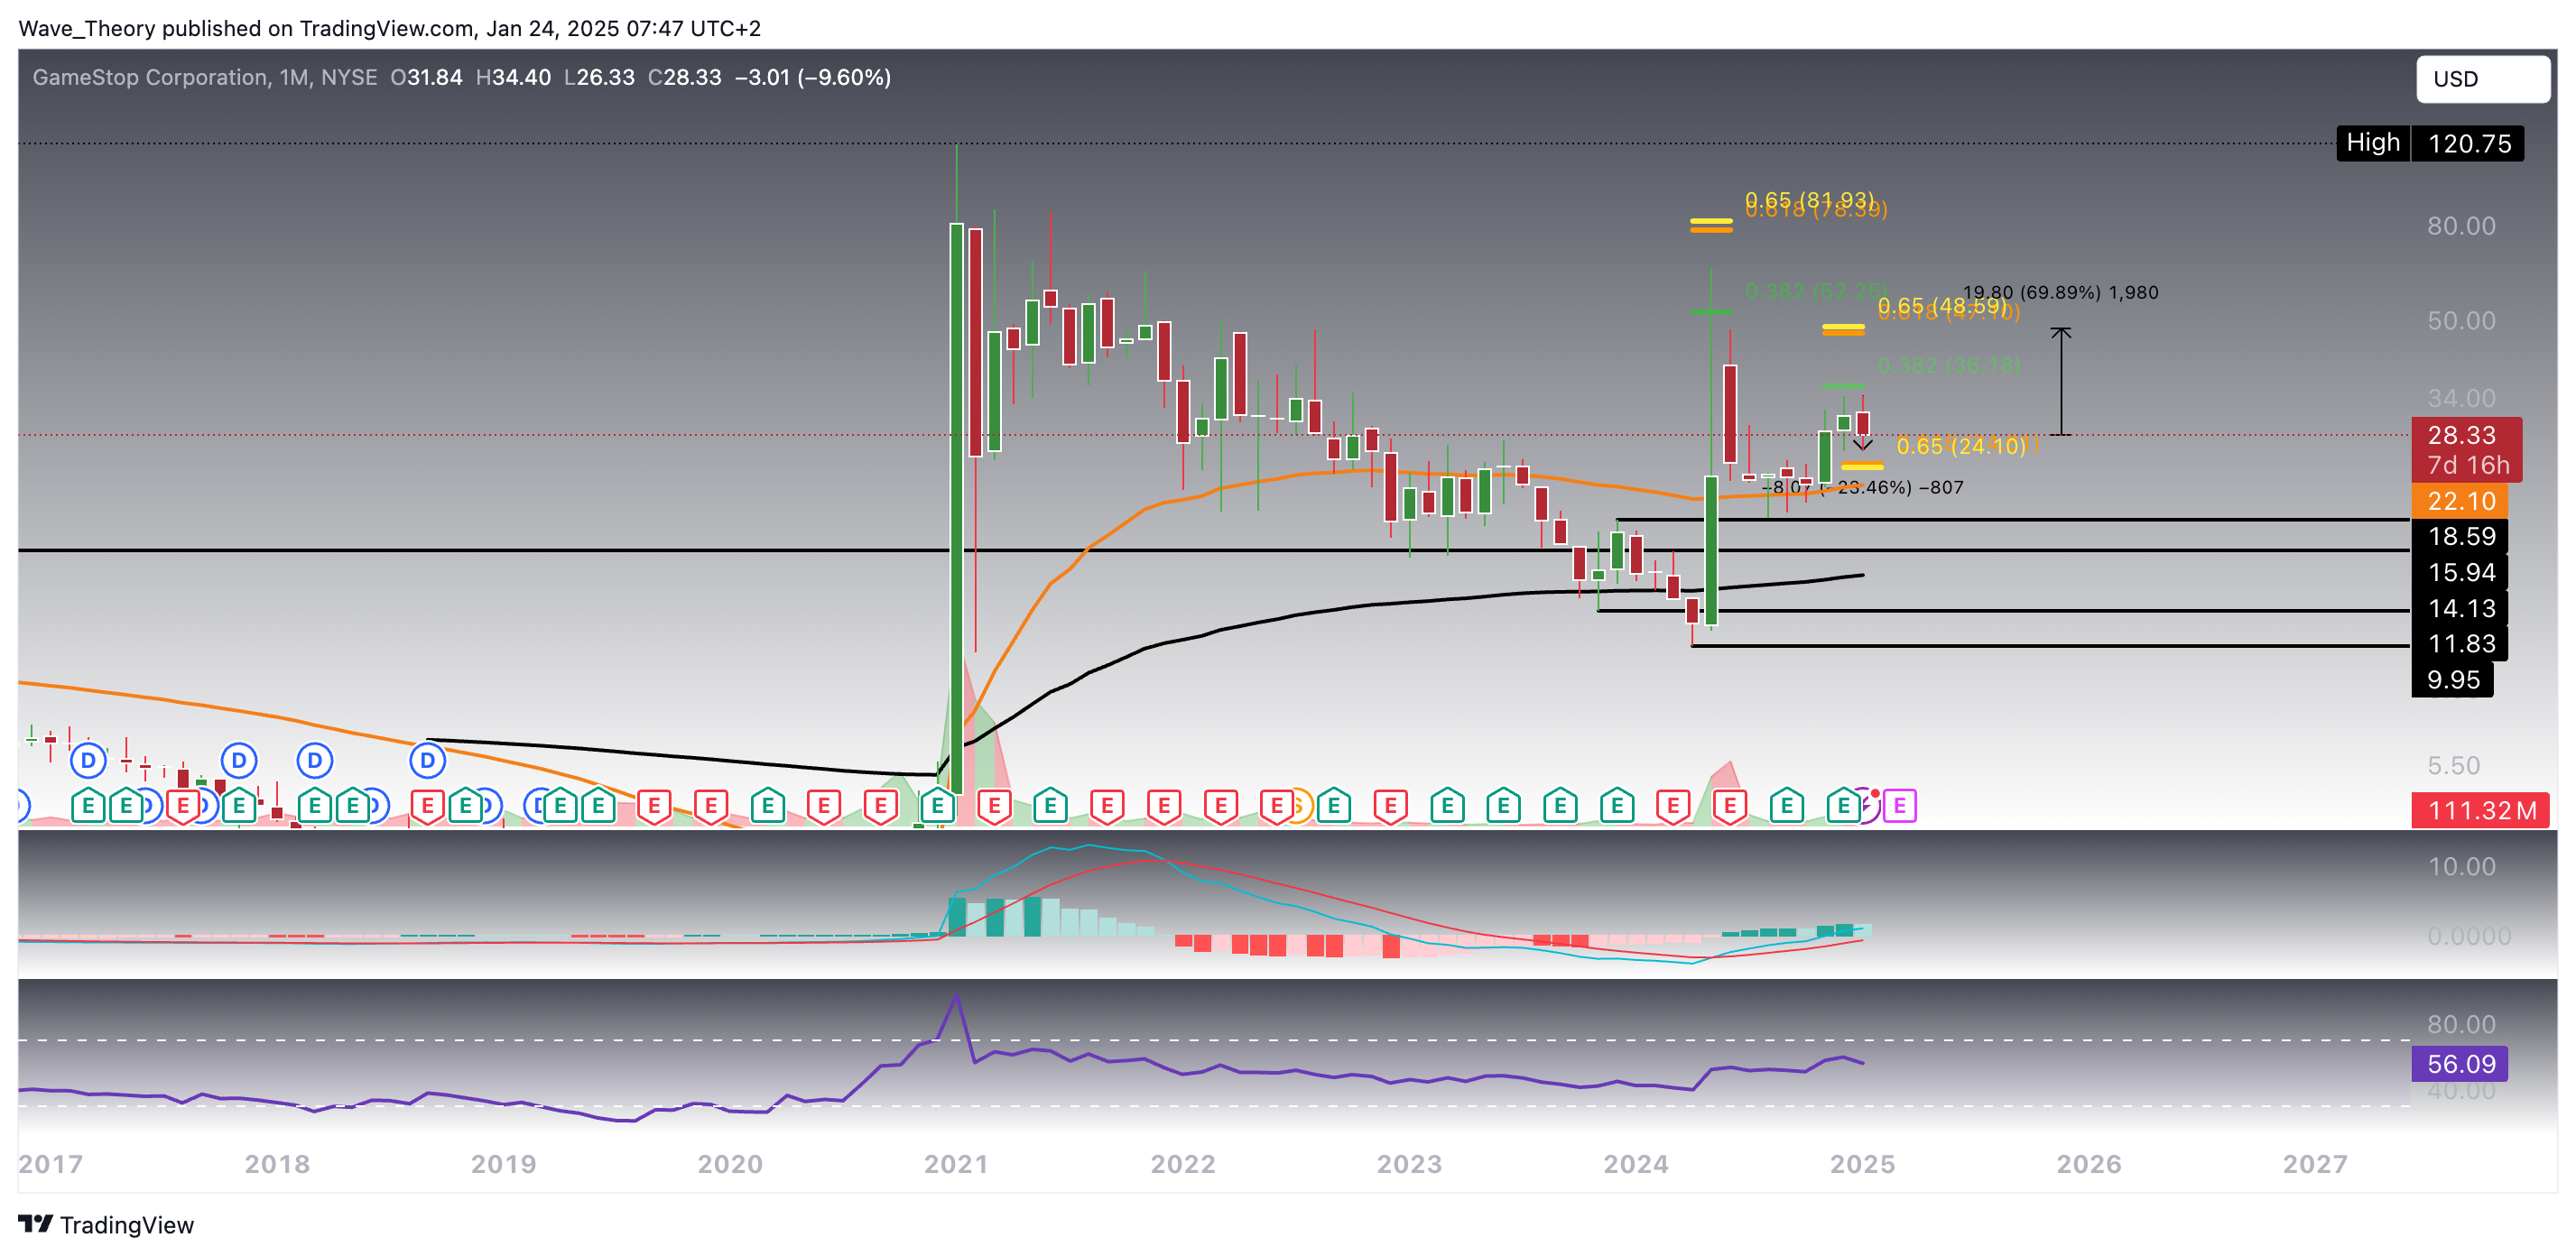
GameStop Experiences A Bearish Month So Far
January has been a bearish month for GameStop (GME), with the stock retracing by 23.5% and potentially extending this downward move. The MACD histogram has shifted bearish, ticking lower this month after two months of bullish momentum. However, there are some longer-term bullish indicators to consider: both the MACD lines and the EMAs remain bullishly crossed, suggesting a positive outlook in the long run. Meanwhile, the RSI is neutral, providing no clear bullish or bearish signals at this time.
Summary
- Check out our free forex signals
- Follow the top economic events on FX Leaders economic calendar
- Trade better, discover more Forex Trading Strategies
- Open a FREE Trading Account
Related Articles


Comments
Sidebar rates
Related Posts
