Forex Signals Brief January 23: Can Pres. Trump Reignite the USD and BTC Rally Later Today?
Today US President Donald Trump will speak at the World Economic Forum, which might be appealing to the crypto and forex markets.

Live BTC/USD Chart

Today US President Donald Trump will speak at the World Economic Forum, which might be appealing to the crypto and forex markets.

After a few days of heightened activity driven by Trump’s policy moves, the US market experienced a quieter session. The economic calendar was relatively light, with Canada’s Producer Price Index (PPI) inflation coming in below expectations at 0.2% versus the forecasted 0.6%. Concerns over potential tariffs led to a decline in the USD/CAD , which fell back to 1.4370. Meanwhile, the EUR/USD extended its gains, reaching levels around 1.0450, last seen in December.
Unlike other markets, US equities managed to close higher, with the S&P 500 setting a fresh intraday high at 6100. However, the index was unable to sustain those gains, closing just below the record level. The Dow Jones Industrial Average rose 130.92 points or 0.30% to close at 44,156.73, while the S&P 500 increased by 37.13 points or 0.61% to finish at 6,086.30, just shy of the record closing high of 6,090.27. The intraday peak reached 6,100.81. The NASDAQ gained 252.56 points or 1.28% to settle at 20,009.34. In contrast, the Russell 2000 declined by 14.24 points or 0.61% to end at 2,303.71, snapping a six-day winning streak.
US bond yields finished higher despite a solid 20-year bond auction, which saw strong demand with a bid-to-cover ratio of 2.75x, well above the six-month average of 2.5x. The 2-year yield increased by 1.9 basis points to 4.299%, while the 10-year yield rose 3.9 bps to 4.613%. Overall, the markets had a steady session, with equities holding firm and bond yields inching higher amid investor caution.
The EIA crude Oil inventories showed an increase of 1 million barrels, which didn’t help Oil prices retreat, with WTI falling to $75. Cryptocurrencies also retreated, with Bitcoin ending $2,000lower, but holding above $100K while Ethereum remains trading in a range. Ripple XRP ended the ay higher instead, with a 7 cent gain.
Today’s Market Expectations
Today we have the retail sales from Canada, with core sales expected to show a minimal 0.1% increase, while headline sales are expected to slow from 0.6% in the previous month to 0.2% this time. This comes after a slowdown in the PPI producer inflation that we saw yesterday and tariff threats from the US, so the CAD should remain weak.
The US Jobless Claims report continues to be a crucial weekly indicator of labor market conditions. As a more timely measure compared to other employment data, it provides valuable insight into the health of the job market. While there has been some recent easing, continuing claims remain near their cycle highs, indicating persistent challenges. Initial claims, however, have stayed within the 200K–260K range that has been consistent since 2022. For the upcoming report, initial claims are expected to rise slightly to 218K from last week’s 217K, while continuing claims are forecasted to increase to 1,861K from the previous 1,859K.
Later in the evening, US president Donald Trump will hold a speech in Davos at the World Economic Forum meeting, where leaders from different countries and sectors meet annually. Trump and a core number of WEF leaders are not in the greatest terms together, so this will be fun to watch, however crypto traders will be following his speech for any clues on the cryptocurrency market.
Yesterday the markets were quieter, with the USD continuing the retreat, and Gold continuing the surge. Risk currencies also continued the climb higher, with no actual threat with tariffs. We opened 5 trading signals in total, ending the day with four winning forex signals and a losing trade.
Gold Climbs Above $2,700 Again
Gold (XAU/USD) has regained momentum this month after finding solid support above the 20-week simple moving average (SMA). Last month, prices dropped by $100 following a failed attempt to surpass the key $2,725 resistance level but stabilized near the 20-week SMA, where a doji candlestick signaled a potential bullish reversal. This was followed by three consecutive bullish weekly candles, driving the price above $2,700 on Monday. With buyers pushing higher yesterday, gold managed to break through the critical $2,730 resistance level, putting it on track to revisit its all-time high.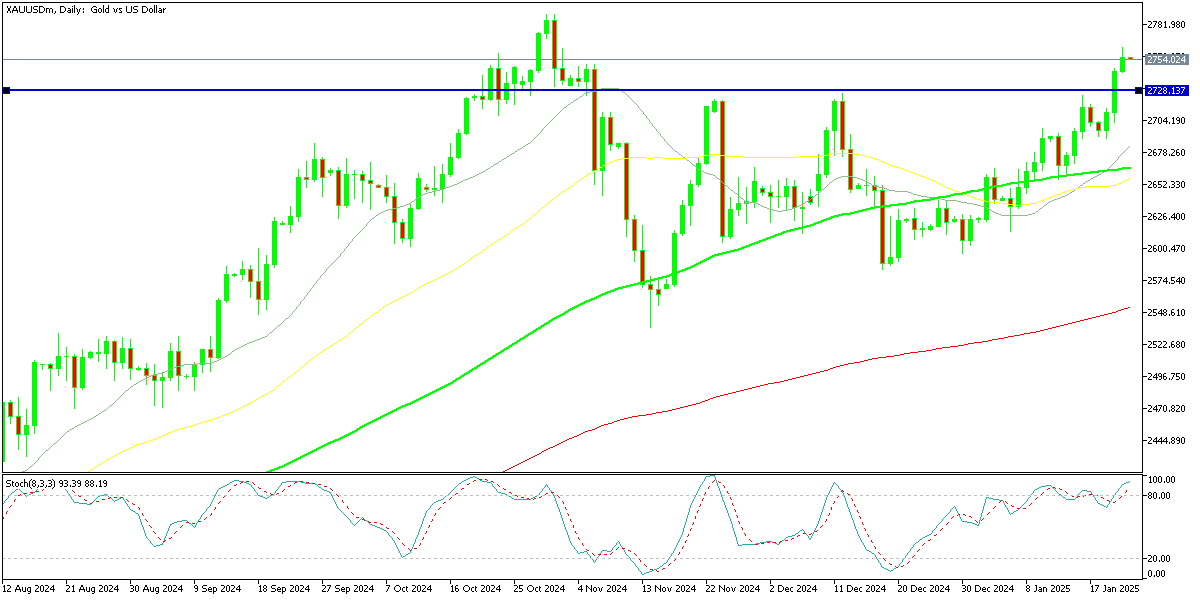
XAU/USD – Daily Chart
EUR/USD Faces the 50 Daily SMA After Climbing Above 1.04
The EUR/USD exchange rate has faced persistent selling pressure in the forex market, declining nearly 10 cents since turning negative from levels above 1.11 in late September. However, Monday saw a strong bullish move fueled by a weaker USD. On the daily chart, the price broke above the 20 SMA but struggled at the 50 daily SMA, briefly touching 1.2456 before retreating below it during the US trading session.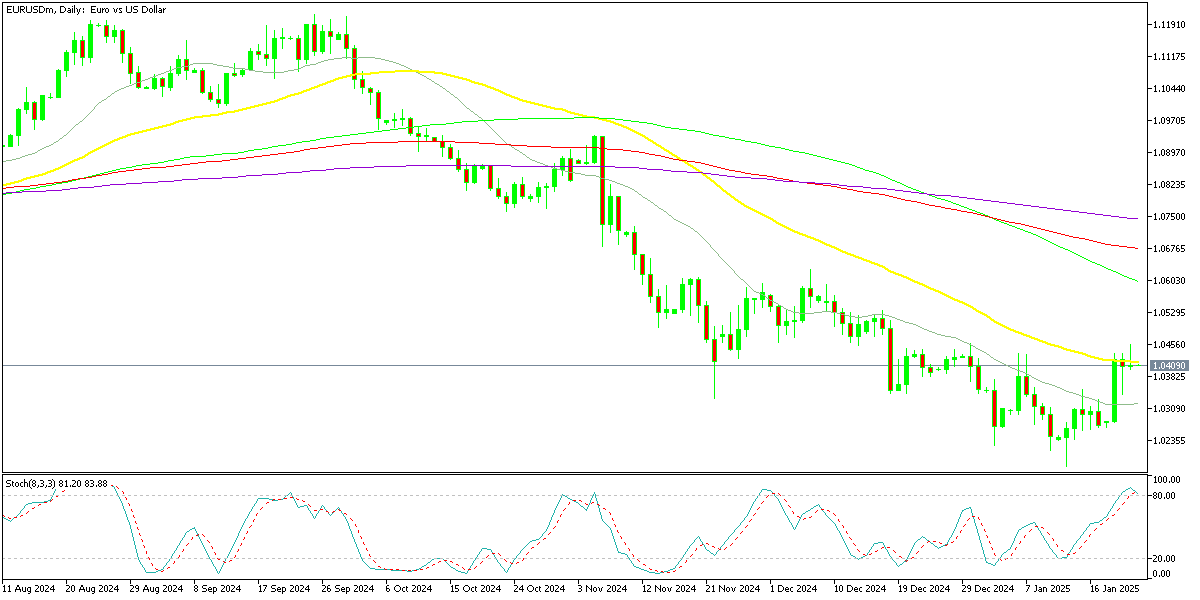
EUR/USD – Daily Chart
Cryptocurrency Update
Bitcoin Consolidates Above $100K
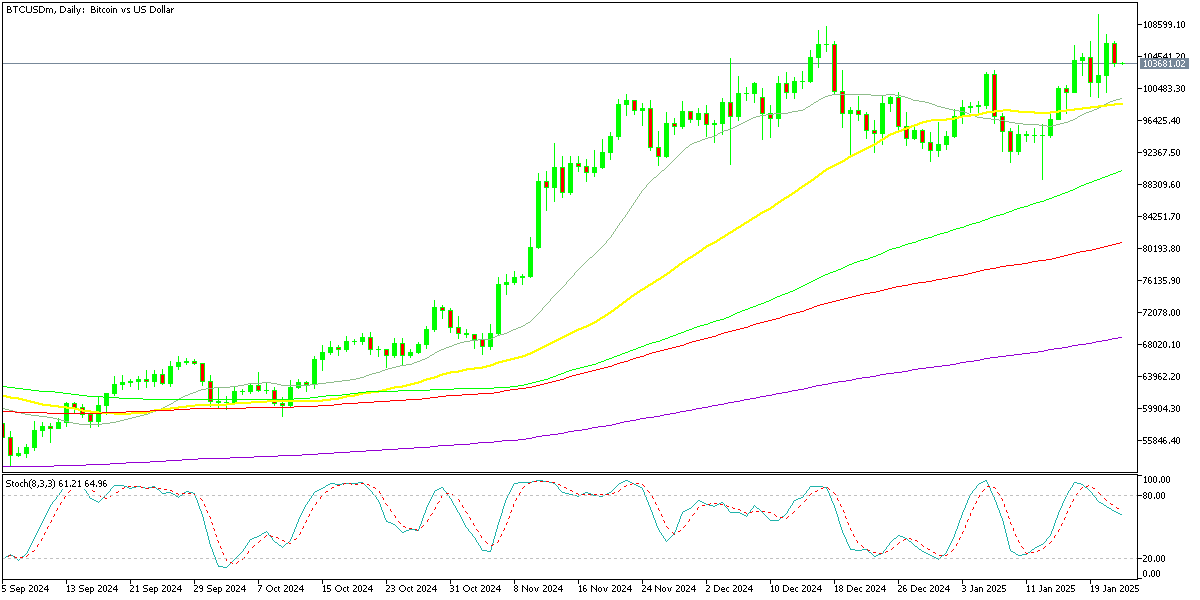
BTC/USD – Daily chart
Ethereum Stuck between MAs
Ethereum (ETH/USD) has also seen sharp price fluctuations. Initially finding support near the 50-day SMA, ETH faced selling pressure that pushed it below $3,500 and then $3,200. During Monday’s broader market sell-off, ETH briefly dipped below $3,000, but renewed buying interest sparked a recovery. Despite reaching $4,000 midweek, the price failed to hold and slipped back below $3,000. However, strength in the broader cryptocurrency market over the past two weeks has helped Ethereum regain levels above $3,500. however yesterday the 20 daily SMA rejected the price.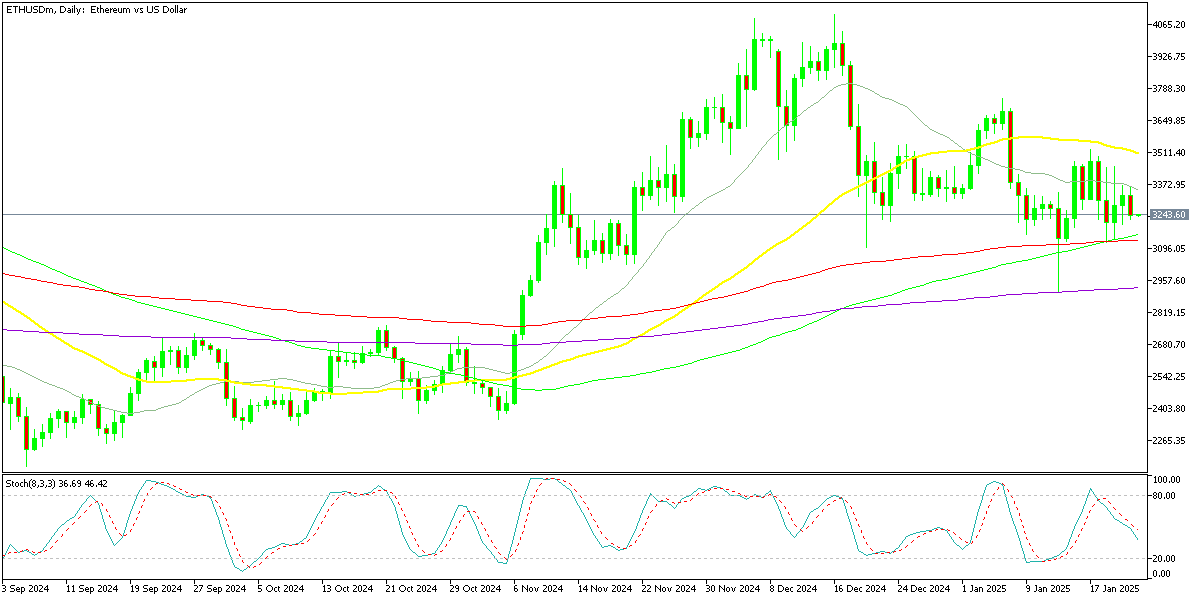
ETH/USD – Weekly Chart
- Check out our free forex signals
- Follow the top economic events on FX Leaders economic calendar
- Trade better, discover more Forex Trading Strategies
- Open a FREE Trading Account
Related Articles

Comments
Sidebar rates
Related Posts
