Forex Signals Brief January 22: Trump and WEF Converge on AI, Oracle Stock Surges 7%

Yesterday was the first day of Donald Trump in Office, and the volatility remained elevated, with risk assets resuming the surge after a retreat in the morning.

| Broker | Review | Regulators | Min Deposit | Website | |
|---|---|---|---|---|---|
| 🥇 |  | Read Review | FCA, CySEC, ASIC, MAS, FSA, EFSA, DFSA, CFTC | USD 100 | Visit Broker |
| 🥈 | Read Review | FSCA, FSC, ASIC, CySEC, DFSA | USD 5 | Visit Broker | |
| 🥉 |  | Read Review | CySEC, MISA, FSCA | USD 25 | Visit Broker |
| 4 |  | Read Review | ASIC, BaFin, CMA, CySEC, DFSA, FCA, SCB | USD 200 | Visit Broker |
| 5 |  | Read Review | ASIC, FCA, CySEC, SCB | USD 100 | Visit Broker |
| 6 | Read Review | FCA, FSCA, FSC, CMA | USD 200 | Visit Broker | |
| 7 | Read Review | BVI FSC | USD 1 | Visit Broker | |
| 8 |  | Read Review | CBCS, CySEC, FCA, FSA, FSC, FSCA, CMA | USD 10 | Visit Broker |
| 9 |  | Read Review | ASIC, CySEC, FSCA, CMA | USD 100 | Visit Broker |
| 10 |  | Read Review | IFSC, FSCA, ASIC, CySEC | USD 1 | Visit Broker |
As Trump’s tariff rhetoric shifted focus to other regions, Europe remained resilient. There was initial optimism that the proposed tariffs might be less severe than suggested during the campaign or perhaps just political posturing. US stock markets responded positively, with the S&P 500 climbing 0.6% and reaching its highest levels of the day. Despite an initial sluggish start and rising Treasury yields, buying momentum persisted, ultimately pushing the S&P 500 to close over 1% higher.
Tech and Small-Cap Stocks Lead Market Gains
Despite uncertainties surrounding tariffs and economic policy, US equities saw broad-based gains, particularly in the technology and small-cap sectors. The Russell 2000 led the way with a 1.7% increase, while the Nasdaq added 0.7%. The market’s performance underscores investors’ confidence in sectors poised for growth amid evolving economic conditions.Apple continued to struggle, with shares declining by 4.3% as reports of waning iPhone demand in China weighed on the stock. The company approached session lows, highlighting ongoing challenges in one of its key markets. However, broader indices showed resilience, with the Russell 2000 gaining 1.7% and the Nasdaq closing 0.7% higher, signaling strength in other sectors.
Oracle Surges Following AI Infrastructure Deal Announcement
In a major development, President Trump revealed a new AI infrastructure partnership involving Oracle, Softbank, and OpenAI. The announcement fueled a rally in Oracle’s stock, pushing it past its 100-day moving average at $170 as it rallied by 7%. This agreement marks a significant step in the administration’s push for AI advancements within the US. That goes in tandem with the WEF plans which is happening in Davos this week.
Mixed Signals in FX Markets Amid Tariff Speculation
The currency markets offered conflicting signals in response to Trump’s renewed tariff discussions, which included potential 25% levies on imports from Mexico and Canada. Initially, the US dollar strengthened on the news, but as no concrete threats materialized, the greenback lost momentum. By the end of the trading session, the dollar weakened against all major currencies, with the EUR/USD pair rising above 1.04.
Bitcoin started the day around $100K after retreating, following a new record high yesterday, while Ethereum consolidated below $3,500.
Today’s Market Expectations
The only important event in the forex calendar today was released early in the morning.
Yesterday the markets remained volatile in the first day of Donald Trump entering office, as the USD turned higher on the tariffs talk on Canada and Mexico but turned lower later since there won’t be tariffs right away, which got many traders on the wrong foot. We had two losing trades early in the day, but made up later with more winning forex signals.
Gold Climbs Above $2,700 Again
Gold (XAU/USD) has regained its upward momentum this month after finding strong support above the 20-week simple moving average (SMA). Last month’s failed attempt to break the critical $2,725 resistance level resulted in a $100 pullback, but prices stabilized near the 20-week SMA, where a doji candlestick signaled a potential bullish reversal. This was followed by three consecutive bullish weekly candles, leading to a move above $2,700 on Monday. Yesterday, buyers pushed higher and overcame the key $2,730 resistance level, so Gold is heading for the all time high again now.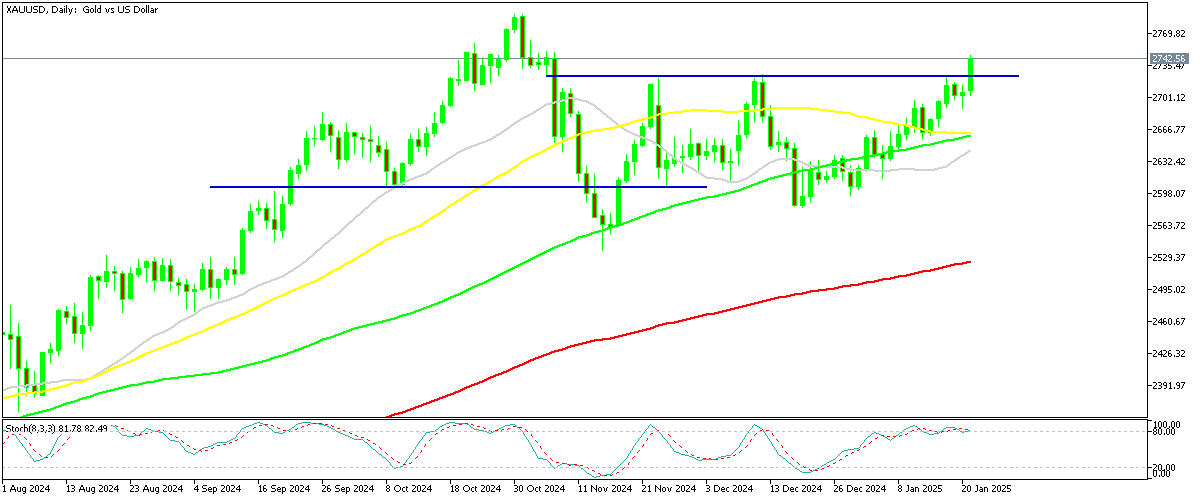
XAU/USD – Daily Chart
EUR/USD Faces the 50 Daily SMA After Climbing Above 1.04
In the forex market, EUR/USD has been under sustained selling pressure after turning bearish from levels above 1.11 in late September and losing around 10 cents until last week. However it made a strong bullish move on Monday, mostly due to the weak USD. The price broke above the 20 SMA (gray) on the daily chart and now buyers are facing the 50 daily SMA (yellow).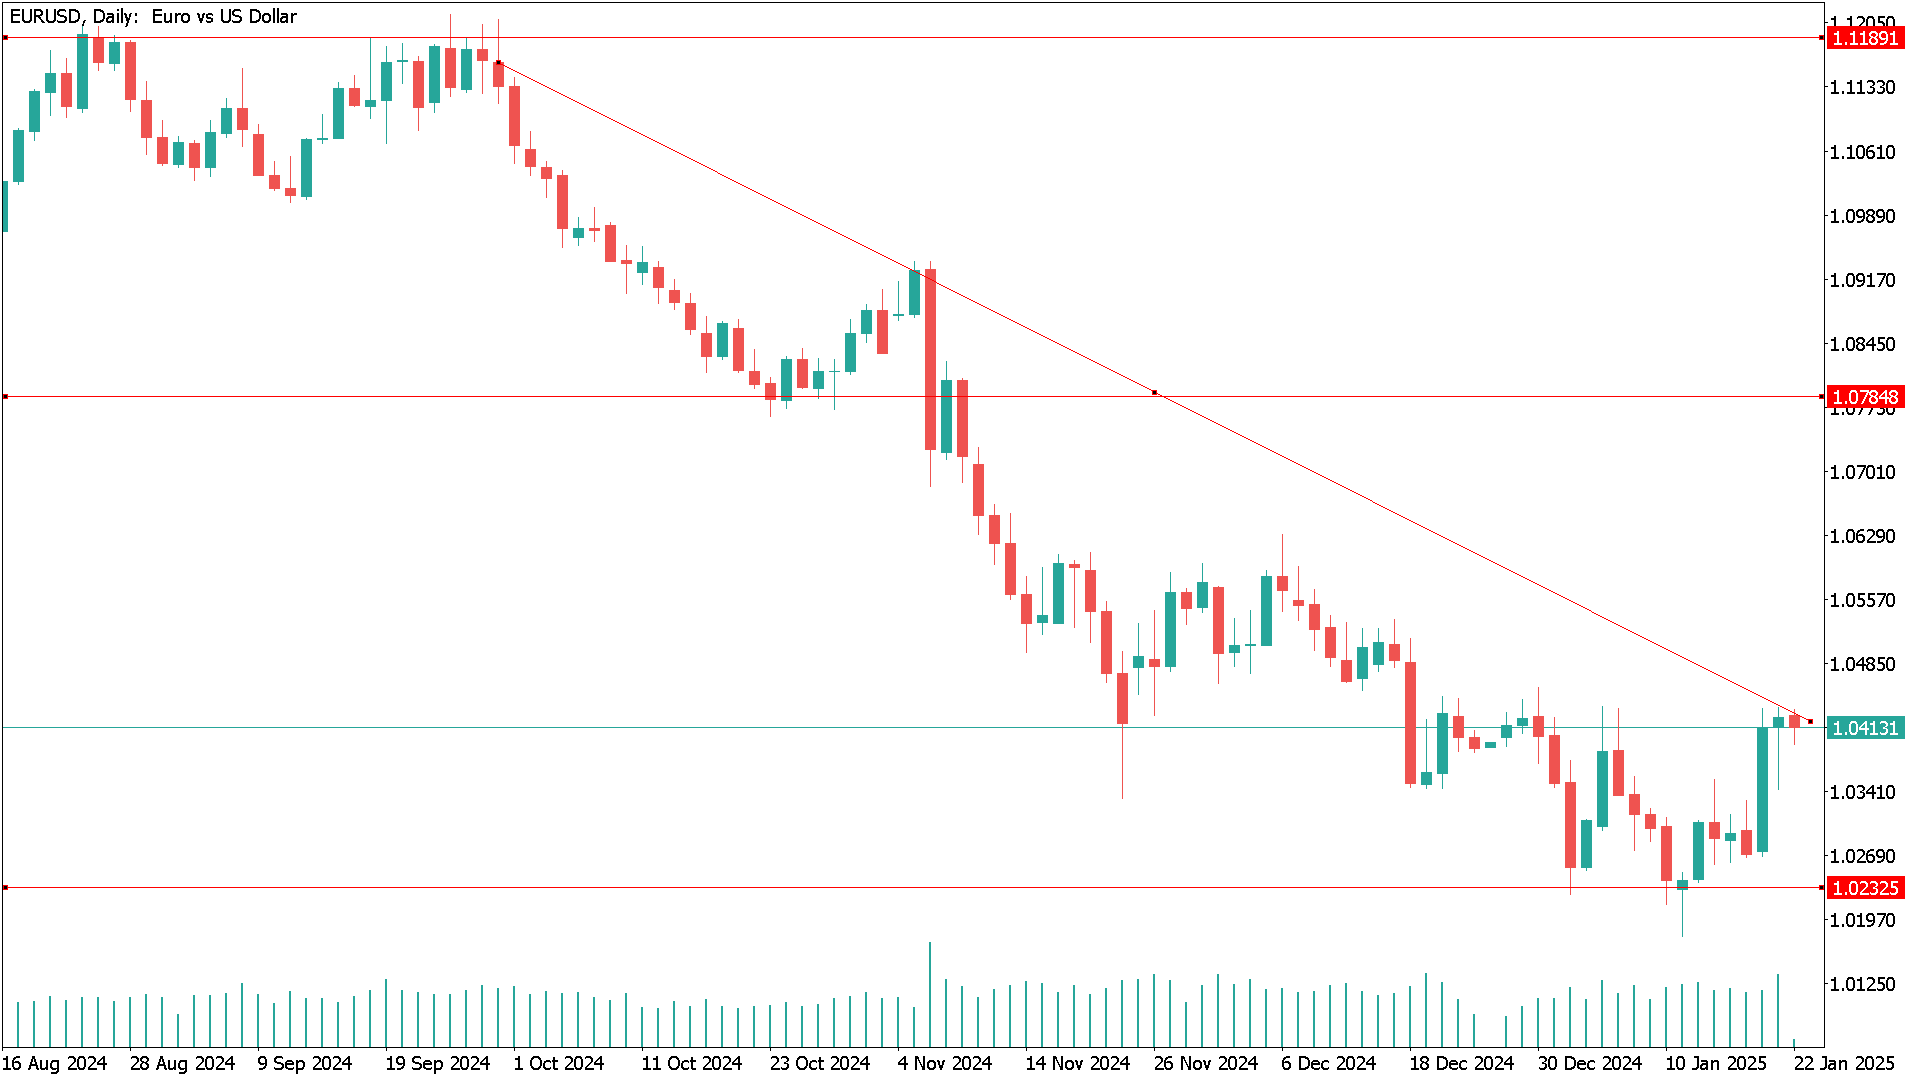
EUR/USD – Daily Chart
Cryptocurrency Update
Bitcoin Consolidates Above $100K

BTC/USD – Daily chart
Ethereum Stuck between MAs
Ethereum (ETH/USD) has also seen considerable volatility. Despite initially finding support near its 50-day SMA, selling pressure pushed the price below $3,500 and subsequently under $3,200. ETH briefly fell below $3,000 on Monday during a broader market sell-off, but renewed buying interest spurred a recovery. Ethereum climbed to $4,000 midweek but failed to sustain the gains, retreating below $3,000. Nevertheless, broader crypto market strength over the past two weeks has helped ETH regain ground above the $3,500 level.
ETH/USD – Weekly Chart


Add 3442

Related Posts
Add 3440