CAC Halts Rally as Trump Takes Office – New Car Registrations for EU Jump
Trump takes office keeping tariff hikes on the table, causing jitter in the stock market. New EU car registrations jump in December.

- CAC opens flat as market eyes risk
- YoY new car registration show surprise jump of 5.1%
- Renault overtakes Stellantis in market share
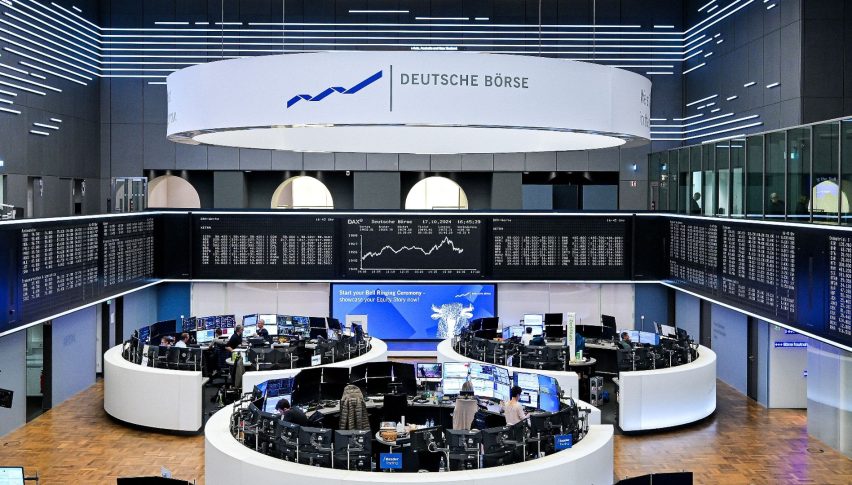
The CAC opened flat on the day, posting a minimal gain of 0.03% on yesterday’s close. While European peers such as the FTSE and the DAX posted new all-time highs this year the CAC has lagged in performance.
Global markets take a cautious note as investors await the first executive orders from Trump, which are forecast to show large tariff hikes.
New Car Registrations Beat Forecasts
EU New Car Registrations YoY were forecast at -2.2% for December 2024 but showed a large swing higher printing at 5.1%.
The data released by the ACEA (European Auto Manufacturers Association) showed that 2024 saw an increase in new sales of 0.9%.
The latest increase in new sales came from hybrid cars, representing 38% of all new registrations.
For the first time, since Stellantis was forged in 2021, Renault overtook the Franco-Italian conglomerate in market share.
Despite the positive news the CAC failed to show any real signs of a reaction. The index is basically flat on the day.
CAC Live Chart
CAC Technical View
The day chart below for the CAC shows a market attempting to break into a bullish trend. Technically we can consider the last rally, which brought the market above the Ichimoku cloud, as placing the index in a bullish trend.
However, we still need to see the market close above the recent peak of 7,804 (blue line). That high gave way to a correction of 711 points or 9.11%.
There is major support at 7,708 (red line), which corresponds to 3 failed attempts to break higher in July 2024.
Below that, the next support is on the belly of the cloud, and the level of 7,334 (black line).
To the upside, the first hurdle is at 7,804, further resistance will be found at 7,904 (green line), which corresponds to the support area that gave way to a major correction in May 2024.


