Forex Signals Brief January 14: US PPI Inflation Could Bring Back USD Buyers
Yesterday the USD was on retreat after the gains last week, but might resume the uptrend again if the PPI inflation comes above expectations
Live BTC/USD Chart

Yesterday the USD was on retreat after the gains it made last week, but it might resume the bullish trend again if the PPI inflation comes above expectations.
Yesterday the forex markets were quiet for the most part, with the USD on the retreat, albeit slowly. EUR/USD fell below 1.02 in the morning but recuperated in the US session, while GBP/USD fell to 1.21 before bouncing to 1.22 again by the end of the day. GOLD was the biggest looser, as XAU/USD closed the day around $30 lower.
The NASDAQ index lagged behind its U.S. stock market peers, as most major indices ended the day in positive territory, including the Russell 2000. The S&P 500 gained 10 points (0.15%) to close at 5836.22, while the DOW Jones Industrial Average rose 358.67 points (1%) to finish at 42297.12. Conversely, the NASDAQ Composite fell 74 points (-0.5%) to end at 19088.10. Meanwhile, the small-cap Russell 2000 advanced 5 points (0.2%) to 2194.40.
Today’s Market Expectations
Today the economic calendar is light apart form the US PPI inflation later. In New Zealand, business confidence saw a strong rebound, according to the NZIER Quarterly Survey of Business Opinion (QSBO). Confidence climbed to +16% in Q4, recovering from a -1% decline in the previous quarter, signaling improved sentiment among businesses.
On the U.S. inflation front, the Producer Price Index (PPI) is expected to show a year-over-year (Y/Y) increase of 3.0%, unchanged from the prior reading, while the month-over-month (M/M) measure is forecasted at 0.3%, slightly lower than the previous 0.4%. For the Core PPI, Y/Y growth is projected at 3.2%, down from 3.4%, and the M/M measure is expected to hold steady at 0.2%. While the PPI will provide initial insights, the Consumer Price Index (CPI) report due the following day is expected to have a greater impact on market sentiment.
Last week the USD started it on the back foot after the rumours for no tariffs, but on Tuesday the price action reversed and the USD resumed the larger uptrend, which made it easier for traders. We opened 28 trading signals in total, closing it with 20 winning forex signals and 8 losing ones.
Gold Returns to the 50 Daily SMA
Last month Gold experienced a $100 decline after failing to surpass the critical resistance level at $2,725. Last week, the 50-day Simple Moving Average (SMA) acted as resistance, but the price attracted buyers as it dropped below the 100-day SMA. Initially, gold struggled to move above the 50-day SMA despite some recovery. However, buyers managed to push the price beyond this level on Wednesday, and by yesterday, it had stabilized above the 50-day SMA, but yesterday sellers returned and XAU fell back to the 50 SMA, losing $30.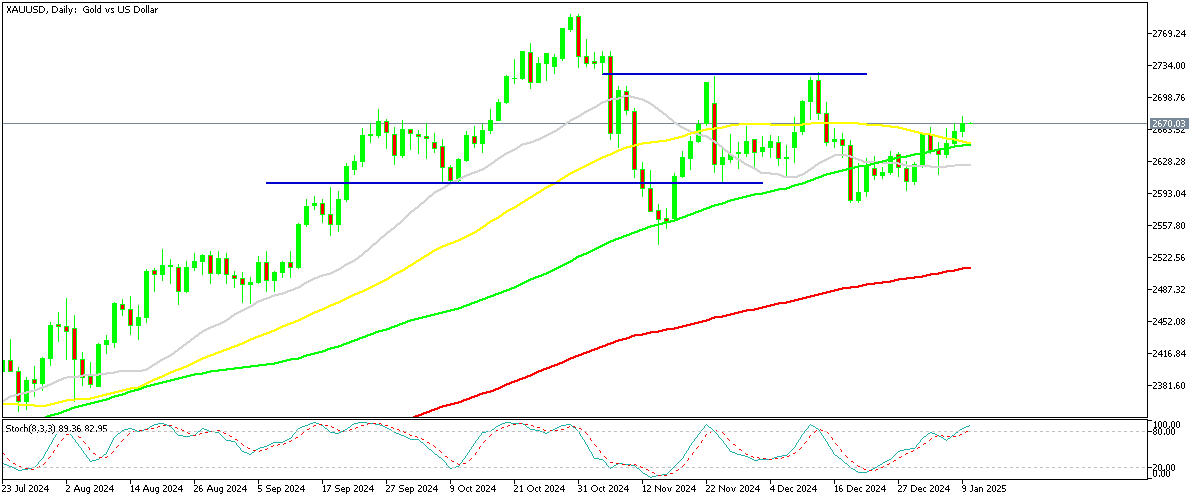
XAU/USD – Daily Chart
GBP/USD Breaks Below 2024 Low
The GBP/USD currency pair saw a sharp downturn in October, falling below all major daily moving averages and losing over 12 cents in total. This downtrend persisted yesterday, with the pound falling by more than a cent and closing below 1.23, marking a new 2024 low.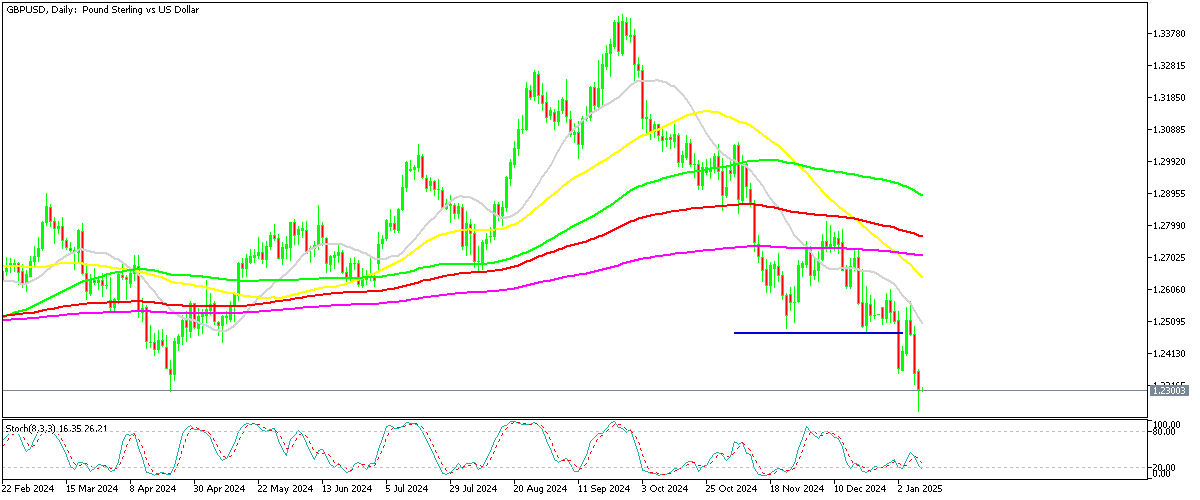
GBP/USD – Daily Chart
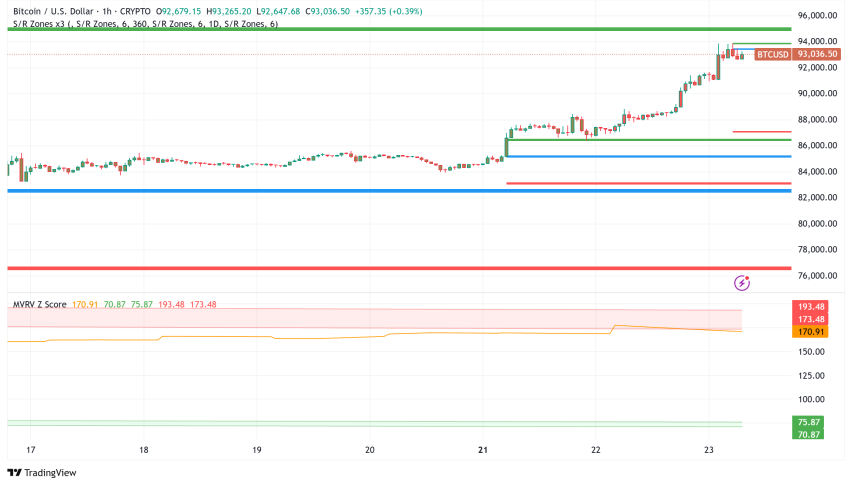
Cryptocurrency Update
Bitcoin Rebounds Off the $90K Support Zone

BTC/USD – Daily chart
Ethereum Returns Above $3,000 After Dipping Below This Level
Ethereum exhibited even greater volatility, spiking from $3,000 to nearly $4,000 midweek before losing momentum and falling below $3,500. Over the past two weeks, Ethereum has recovered some losses, finding robust support near the 50-day SMA. Nonetheless, renewed bearish sentiment pulled the price below $3,500 again and Ethereum had slipped further to $3,200. Yesterday we saw another bearish move which sent the price below $3,000 briefly, but buyers returned in the US session.
ETH/USD – Weekly Chart
- Check out our free forex signals
- Follow the top economic events on FX Leaders economic calendar
- Trade better, discover more Forex Trading Strategies
- Open a FREE Trading Account
Related Articles


Comments
Sidebar rates
Related Posts
