


Bitcoin on Edge: Hash Rate Drops & Bearish Divergence Looms
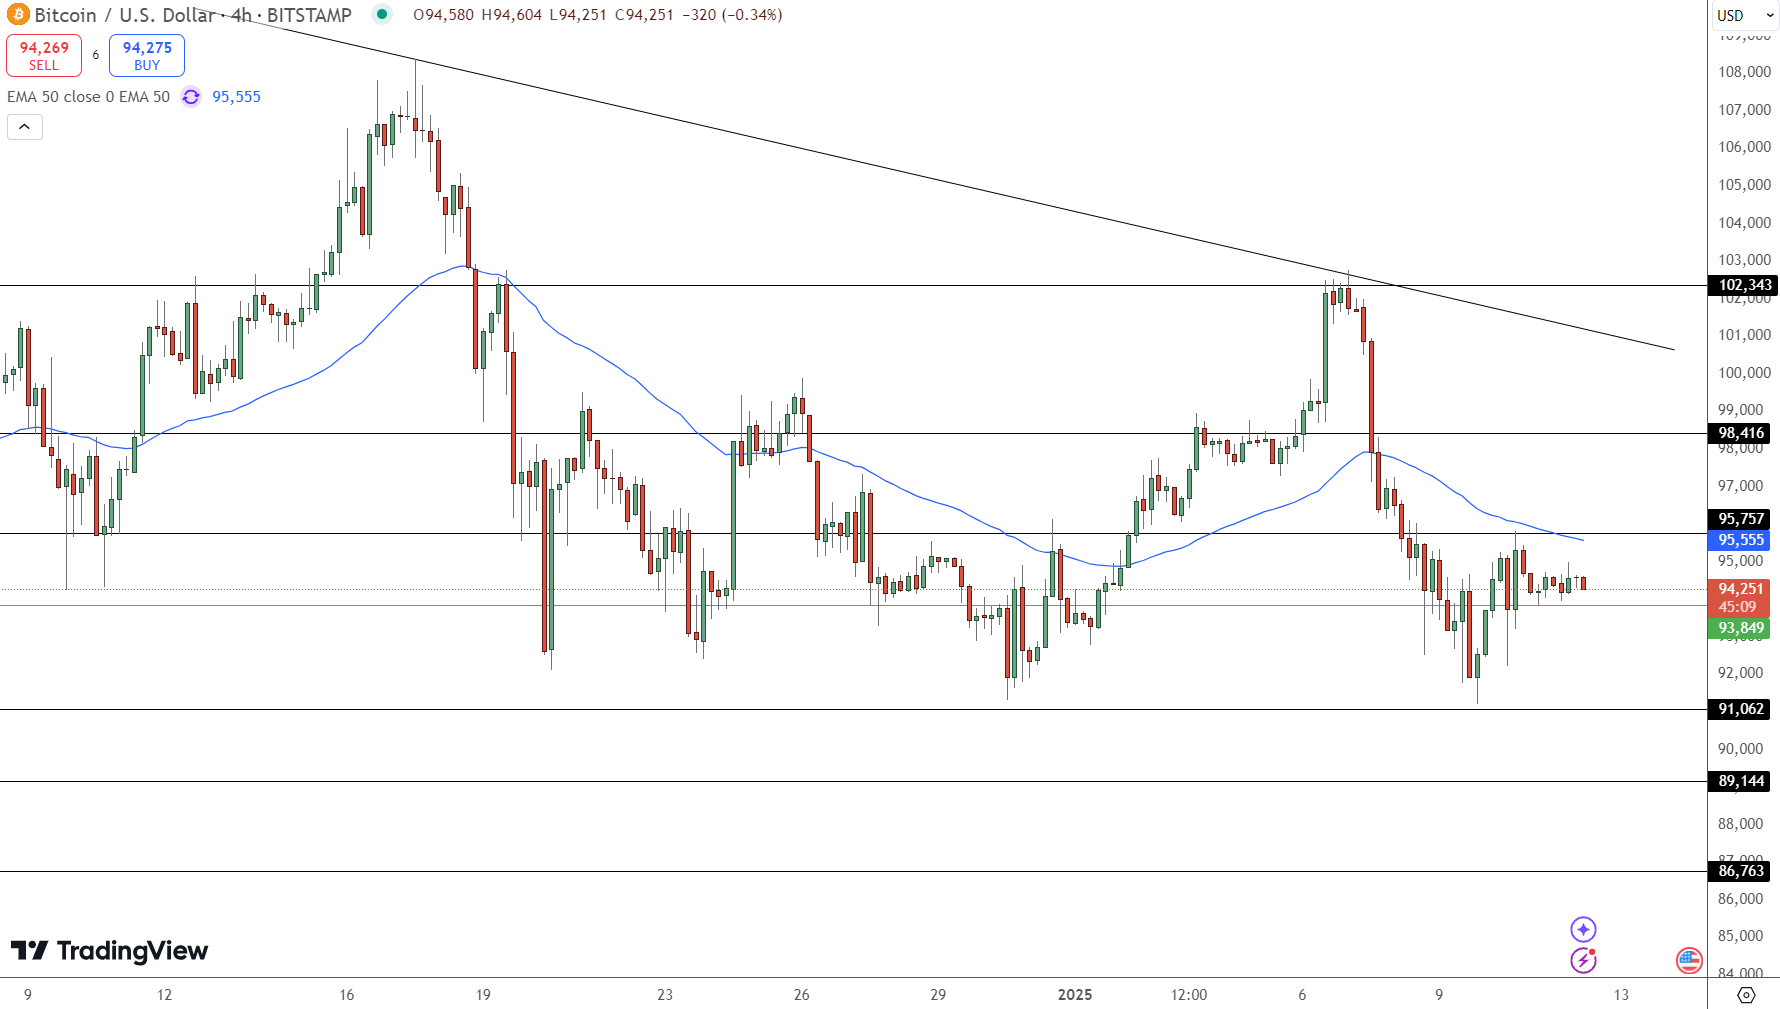
Bitcoin (BTC) traded around $94,296 on Saturday, grappling with bearish market signals as macroeconomic factors and on-chain data hinted at potential risks.

The cryptocurrency market closely followed the U.S. Bureau of Labor Statistics’ report, which revealed the addition of 256,000 jobs in December and a dip in unemployment to 4.1%.
The robust economic data triggered a sell-off in U.S. equities, with the Dow Jones and Nasdaq 100 dropping by 697 and 317 points, respectively. Bond yields surged, with the 30-year yield touching 5.0%, while 10-year and 5-year yields rose to 4.76% and 4.57%, respectively. These rising yields reinforced expectations of a hawkish stance from the Federal Reserve, impacting risk assets like Bitcoin and altcoins.
Bitcoin Hash Rate and On-Chain Metrics Decline
Recent on-chain data highlighted a decline in Bitcoin’s hash rate, an essential indicator of network strength. As of January 11, the hash rate dropped to 750 TH/s, below its 30-day high of 911.88 TH/s and average of 793 TH/s.
Other metrics also painted a cautious picture. Active Bitcoin addresses slipped from 900,000 earlier in the week to 775,000, signaling reduced network activity. Moreover, spot Bitcoin ETFs reported cumulative outflows of $572 million over the past two days, according to SoSoValue. These trends suggest some investors are exiting positions amid market uncertainty.
Bearish Divergence Threatens Key Support Levels
Technical indicators underscore potential bearish risks for Bitcoin. On the daily chart, BTC is forming a head-and-shoulders (H&S) pattern, a widely recognized bearish signal, with its neckline near $90,952.
Additionally, the Relative Strength Index (RSI) and MACD both exhibit bearish divergence, with the MACD histogram dipping below the zero line. A breakdown below the neckline could drive BTC toward its 200-day moving average at $78,285, with further downside to $73,985, a level last seen in March 2024.
Potential Upside Remains on Weekly Charts
Despite short-term bearish risks, Bitcoin’s weekly chart shows a bullish pennant pattern that remains valid as long as BTC holds above $90,000. If this pattern holds, it could counteract near-term headwinds and sustain bullish momentum.
Key Takeaways
Hash Rate Dip: Bitcoin’s hash rate fell to 750 TH/s, raising network security concerns.
ETF Outflows: Spot Bitcoin ETFs recorded $572 million in outflows over two days.
Bearish Chart Pattern: A break below $90,952 could trigger further declines to key support levels.
Bullish Possibility: The bullish pennant on the weekly chart signals potential recovery if BTC maintains $90,000.
Investors should remain cautious, monitoring upcoming Federal Reserve decisions and macroeconomic data for further market direction.


Sidebar rates
Related Posts
Add 3440

