


Oil Prices Rise to $69.80 Amid Cooling Inflation and Supply Challenges: What’s Ahead?
Oil prices edged higher on Monday, reaching $69.81, as lower-than-expected U.S. inflation data revived hopes for future monetary policy easing.

The Personal Consumption Expenditures (PCE) Index, a key inflation metric, slowed to 0.1% in November, alleviating some market anxiety after the Federal Reserve’s cautious tone during its December rate cut. IG Markets analyst Tony Sycamore commented that the softer inflation reading has lifted risk assets, including crude oil and equity futures.
Adding to the positive sentiment, the U.S. Senate’s approval of legislation to end a brief government shutdown over the weekend further bolstered investor confidence.
Supply Challenges Loom for Oil Markets
Despite the short-term optimism, the oil market remains weighed down by a growing supply surplus forecast for 2025. Analysts at Macquarie project Brent crude prices to average $70.50 per barrel next year, down from this year’s average of $79.64 per barrel. This outlook is compounded by Sinopec’s research, which indicates China’s oil consumption may peak by 2027, signaling potential long-term demand weakness.
The resumption of the Druzhba pipeline, which halted briefly last week, eased concerns over European supply disruptions. The pipeline, which transports 300,000 barrels per day, restarted operations on Saturday, according to Belarus’ BelTa news agency. Hungarian Foreign Minister Peter Szijjarto also confirmed resumed shipments to Hungary on Sunday.
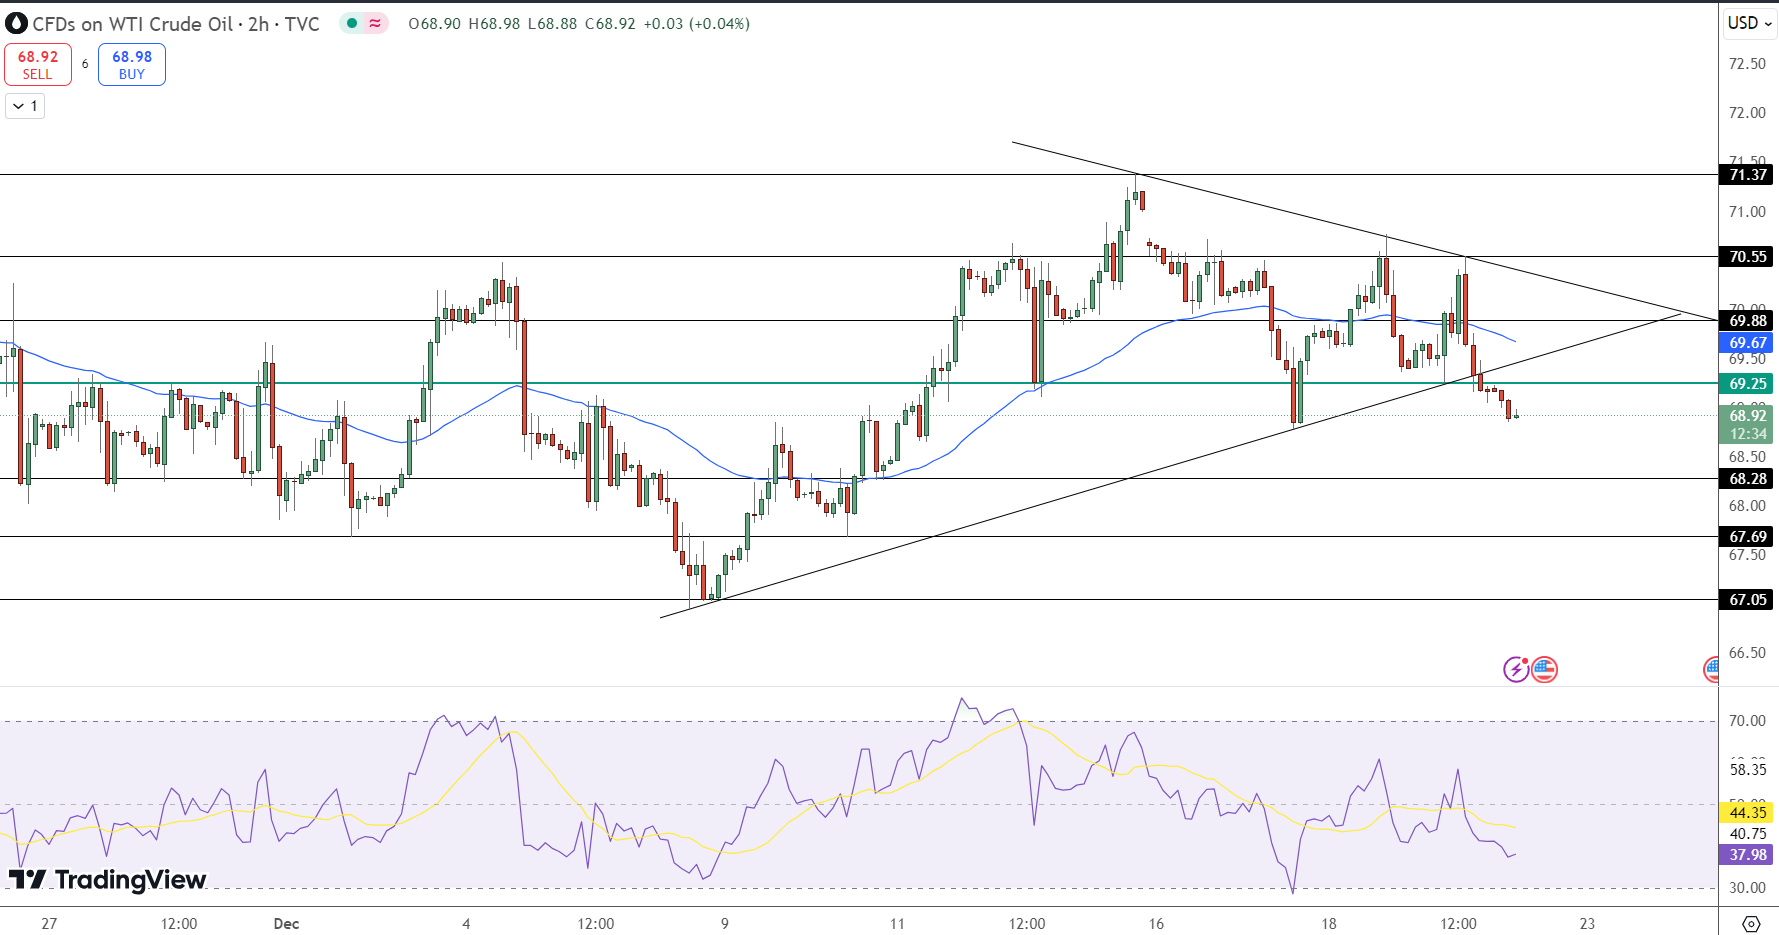
Technical Setup Suggests Short-Term Upside for WTI
WTI Crude Oil prices are stabilizing near $69.81 after recovering from recent lows. The pivot point at $69.54 offers immediate support, while resistance at $70.75 remains a key barrier for further gains. A breakout above this level could open the path to $71.37 and $71.95.
The RSI, currently at 57.92, reflects neutral-to-bullish sentiment, while the 50-day EMA at $69.58 aligns with the pivot point, offering dynamic support. A symmetrical triangle pattern suggests that price volatility is narrowing, indicating a potential breakout in the near term.
Key Insights:
- Immediate Resistance: $70.75; Next levels: $71.37, $71.95.
- Immediate Support: $69.54; Next levels: $68.89, $68.43.
- RSI: 57.92, reflecting neutral-to-bullish momentum.


Sidebar rates
Related Posts
Add 3440

