Double Crash for NZDUSD As New Zealand Falls in Recession
Skerdian Meta•Thursday, December 19, 2024•2 min read
NZDUSD crashed more than 1 cent lower yesterday, after a hawkish FD cut and another contraction in the New Zealand GDP, which puts the economy in recession.

The NZD/USD pair fell by 50 pips following the Federal Reserve’s hawkish rate cut, and another 50 pips after New Zealand’s Q3 GDP showed a -0.1% contraction. This double blow brought the exchange rate down to 0.5620. The pair had already been declining during the Asian and European sessions yesterday, but the sell-off intensified later in the U.S. session.
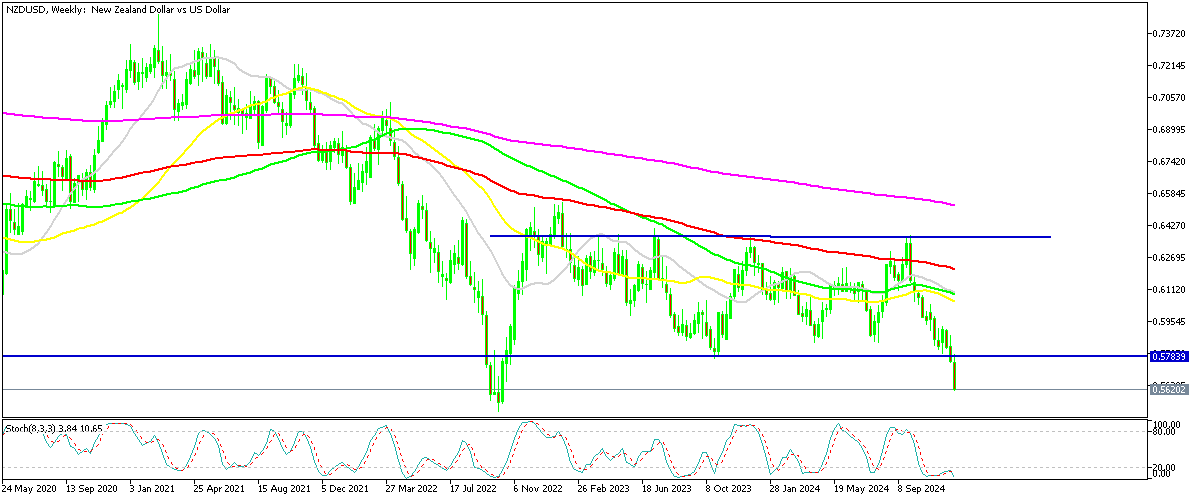
NZD/USD Chart Weekly – The Next Stop Comes at 0.55
With the 2022 low of 0.55 now in sight, the pair is approaching a critical support level. The GDP report, which revealed declines across most sectors and reduced household consumption, underscores New Zealand’s mounting economic challenges. This weak economic data keeps the Reserve Bank of New Zealand (RBNZ) on track to lower interest rates in 2024.
New Zealand Q3 GDP Report (2024)
Key GDP Metrics
- Quarter-on-Quarter (QoQ):
- Contracted by -1.0% (vs expected -0.4%).
- Revised Q2 decline worsened to -1.1%.
- Year-on-Year (YoY):
- Declined -1.5% (vs expected -0.4%).
- Q2 YoY contraction revised to -0.6%.
- Per Capita GDP:
- Fell by -1.2% in Q3.
- Marks the eighth consecutive quarterly decline.
Sectoral Performance
- Declining Sectors:
- Activity dropped in 11 of 16 industries.
- Largest declines:
- Manufacturing
- Business services
- Construction
- Both goods-producing and services industries contracted.
- Growing Sectors:
- Primary industries led by agriculture, particularly dairy farming.
- Gains in rental, hiring, and real estate services.
Expenditure Perspective
- Overall GDP (Expenditure Measure):
- Fell by -0.8% in Q3, mirroring the revised Q2 contraction.
- Household Consumption:
- Declined by -0.3%, largely due to reduced spending on:
- Essentials like groceries and electricity.
- Increases noted in:
- Durable goods, including motor vehicles, audio-visual equipment, and phones.
Insights
- Manufacturing Impact:
- Sharpest decline among all sectors; nearly all sub-industries reduced output.
- Agriculture Resilience:
- Growth in dairy farming and exports (milk powder, butter, cheese) provided partial relief.
- Economic Adjustments:
- Data revisions align with international best practices, highlighting shifts in economic activity and structure.
New Zealand’s Q3 GDP report reflects a worsening economic contraction, driven by steep declines in manufacturing, construction, and services, alongside persistently falling per capita GDP. While agriculture and certain services offered some support, broader economic weakness and reduced household spending highlight the challenges of a shrinking economy. The negative trajectory underscores the need for targeted policy responses by the Reserve Bank of New Zealand which cut rates by 50 bps in the last meeting, to address structural and cyclical economic issues.
NZD/USD Live Chart
NZD/USD
Skerdian Meta
Lead Analyst
Skerdian Meta Lead Analyst.
Skerdian is a professional Forex trader and a market analyst. He has been actively engaged in market analysis for the past 11 years. Before becoming our head analyst, Skerdian served as a trader and market analyst in Saxo Bank's local branch, Aksioner. Skerdian specialized in experimenting with developing models and hands-on trading. Skerdian has a masters degree in finance and investment.