Gold Prices Analysis: Breakout Amid Fed Rate Cut Speculation and Inflation Data
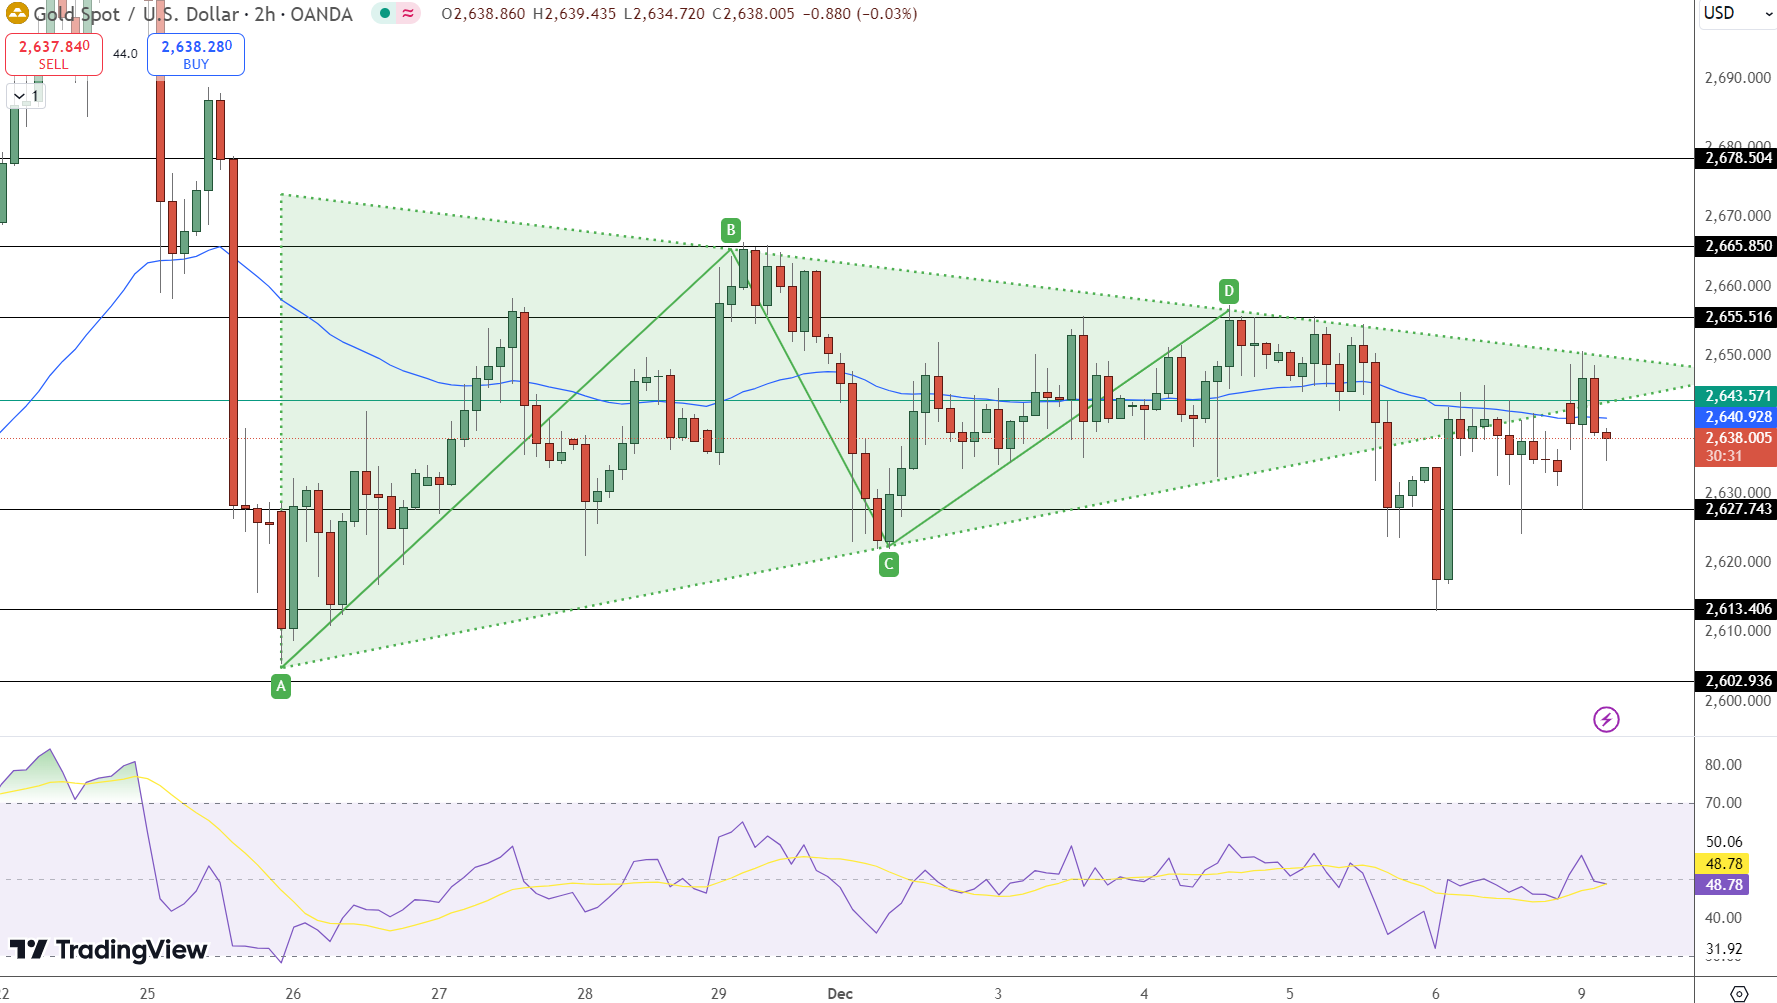
Gold prices, currently trading at $2,638.28, remain steady as investors anticipate U.S. inflation data, due Wednesday...

Gold prices, currently trading at $2,638.28, remain steady as investors anticipate U.S. inflation data, due Wednesday, for cues on Federal Reserve policy.

The market expects an 83.4% likelihood of a 25-basis-point rate cut this month, according to the CME Group’s FedWatch Tool. Lower interest rates could benefit gold, as they reduce the opportunity cost of holding non-yielding assets like bullion.
Adding to the bullish sentiment, China’s central bank resumed gold purchases in November after a six-month hiatus, offering support to gold bulls. IG market strategist Yeap Jun Rong remarked that having the People’s Bank of China (PBOC) backing gold could reinforce confidence in bullion prices.
On the technical front, gold’s symmetrical triangle pattern indicates consolidation, with traders eyeing key resistance at $2,655 and immediate support at $2,627.
Key Price Levels to Watch
Understanding critical price levels is essential for navigating gold’s current consolidation phase:
Pivot Point: $2,643
Immediate Resistance: $2,655
Next Resistance Levels: $2,665, $2,678
Immediate Support: $2,627
Next Support Levels: $2,613, $2,602
The 50-day Exponential Moving Average (EMA) at $2,640 suggests a minor bullish bias, but consistent movement above this level is required to confirm strength. Meanwhile, the RSI at 48.78 reflects a neutral stance, providing no clear directional clues yet.
Fundamental and Geopolitical Impacts
Beyond technicals, geopolitical and economic factors continue to shape gold’s outlook. Federal Reserve officials have hinted at a potential rate cut, aligning with cooling U.S. labor market data. However, if inflation surprises to the upside, the Fed may lean hawkish, strengthening the U.S. dollar and pressuring gold prices.
Meanwhile, geopolitical events such as China’s renewed gold buying underscore growing demand from key markets. Additionally, ongoing global uncertainties could further bolster gold’s safe-haven appeal.
Key Insights for Traders
Gold prices consolidate near $2,643, signaling an imminent breakout.
A bullish move above $2,655 may pave the way toward $2,665 and $2,678.
Sustained weakness below $2,627 could lead to a retest of $2,613 or $2,602.
Traders should monitor inflation data and Federal Reserve commentary this week, as both will likely dictate gold’s next directional move.
- Check out our free forex signals
- Follow the top economic events on FX Leaders economic calendar
- Trade better, discover more Forex Trading Strategies
- Open a FREE Trading Account
Related Articles

Comments
Sidebar rates
Related Posts
