Bitcoin Price Smashes $100,000: Targets $103,800 Amid Breakout Rally
Bitcoin has shattered the $100,000 mark, a historic milestone that has electrified the cryptocurrency market. This landmark price surge is fueled by a bullish breakout from a symmetrical triangle pattern, signaling further upside potential.
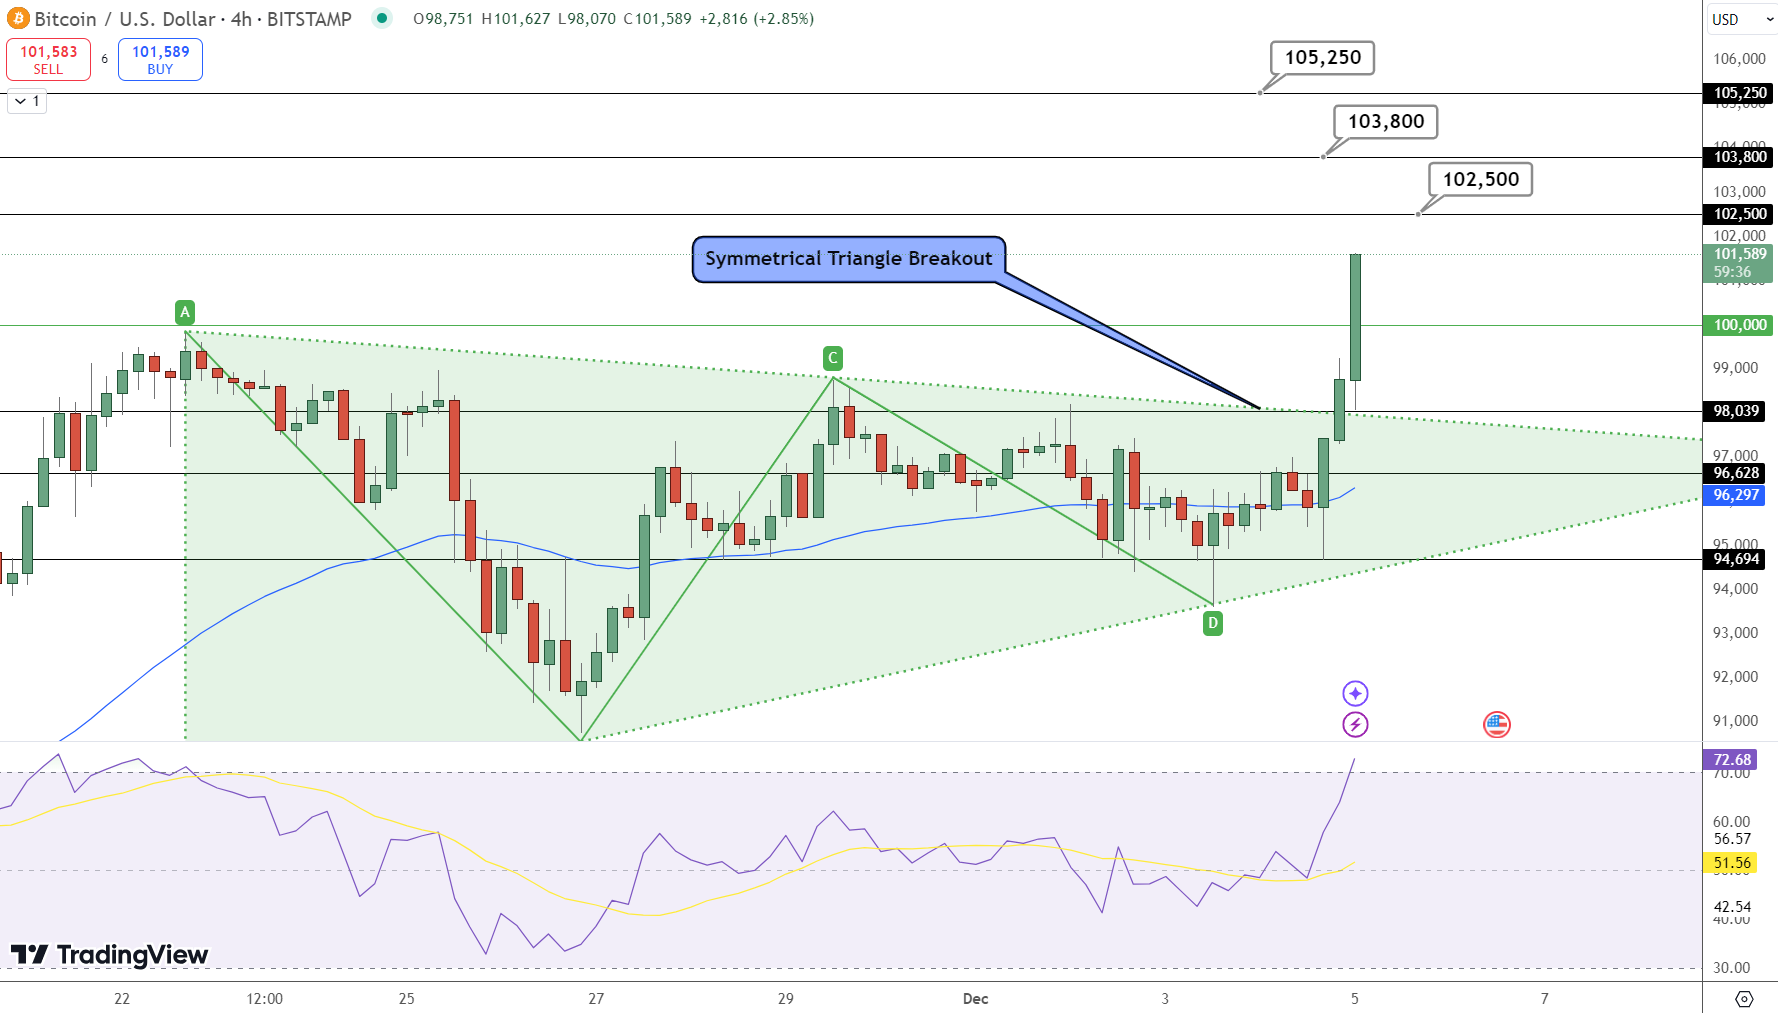
Currently trading at $101,650, Bitcoin’s momentum suggests a strong possibility of testing the next major resistance levels at $102,500 and $103,800 in the near term.
The breakout has been accompanied by significant trading activity, with daily volumes exceeding $89.67 billion, underscoring heightened investor interest. Market sentiment remains overwhelmingly bullish, as Bitcoin leads the charge in the broader crypto market rally.
Key Levels and Indicators Driving Momentum
Resistance Levels to Watch:
- Immediate Resistance: $102,500
- Next Resistance: $103,800
- Major Resistance: $105,250
Support Levels in Case of Pullback:
- Immediate Support: $98,039
- Dynamic Support (50 EMA): $96,628
- Major Support: $94,694
Technical indicators point to overbought conditions, with the RSI at 72.83. While this reflects strong buying pressure, it also suggests the potential for a short-term correction before resuming the rally. The 50 EMA at $96,628 serves as a key support zone that could cushion any pullbacks, keeping the bullish structure intact.
🚨 Breaking News: Bitcoin smashes past $100,000! 🚀📈
Bullish breakout signals targets of $102,500 & $103,800 next. RSI hints at strong momentum but watch for short-term corrections. Is $105,250 in sight? 🔥 #Bitcoin #CryptoNews #BTC pic.twitter.com/1Z251E012G— Arslan Ali (@forex_arslan) December 5, 2024
What’s Next for Bitcoin?
The surge above $100,000 has captivated traders worldwide, with many now targeting $103,800 as the next major milestone. The clean breakout from a symmetrical triangle pattern—combined with the formation of “three white soldiers” on the 4-hour chart—indicates that Bitcoin’s bullish momentum remains robust.
Key takeaways for traders:
- Breakout Confirmed: Bitcoin’s move above $100,000 validates the bullish trend, with $103,800 in sight.
- Support Zones Hold the Key: Retracements could stabilize around $98,039 or the 50 EMA at $96,628.
- Caution Advised: Overbought RSI suggests the possibility of short-term consolidation before further gains.
With Bitcoin’s live market cap nearing $2 trillion and a circulating supply of 19.79 million BTC, the cryptocurrency’s climb to six figures has set the stage for an exciting new phase in its price trajectory.

Sidebar rates
Related Posts
