Solana Price Consolidates Under All-Time Highs as $300 Target Emerges
As the $300 target appears, Solana consolidates close to all-time highs. Despite a slight decline, Solana (SOL) is displaying signals of
As the $300 target appears, Solana consolidates close to all-time highs. Despite a slight decline, Solana (SOL) is displaying signals of resilience as technical indicators and on-chain metrics suggest that there may be more gains ahead.
With a strong trading volume of $5.35 billion, the fourth-largest cryptocurrency by market capitalization is presently trading at $252.82, down 1.5% over the past 24 hours.
Growing institutional interest has caused Solana’s value to rise sharply over the past week, marking a spectacular rebound from its 2022 low of $8. Significant financial companies have expressed growing trust in the platform’s long-term potential by applying for spot Solana ETFs, including Bitwise, VanEck, and 21Shares.
Solana’s NFT Market Resilience
With more than 185,000 purchases in the last week—a 57.99% increase—the Solana NFT market has demonstrated exceptional strength, outperforming all other blockchains. With $23.9 million in weekly sales, Solana remained the third-largest NFT ecosystem, despite a modest fall in the overall NFT sales volume across chains to $158 million.
Solana Ecosystem Development Continues
The ecosystem stats for Solana are still impressive:
- This year, DeFi’s Total Value Locked (TVL) has increased by more than 500% to $8.8 billion.
- Recently, the volume of transfers hit $318 billion.
- There are now 22 million active addresses, and last week’s DEX volumes reached all-time highs of $41.2 billion.
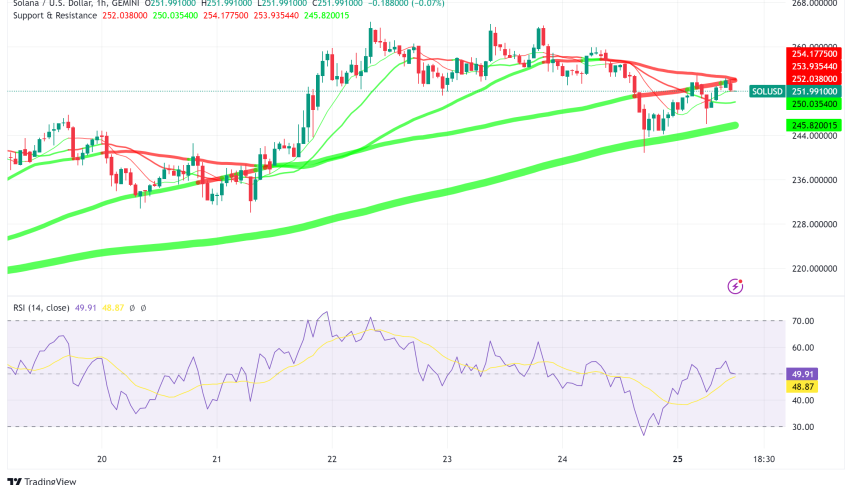
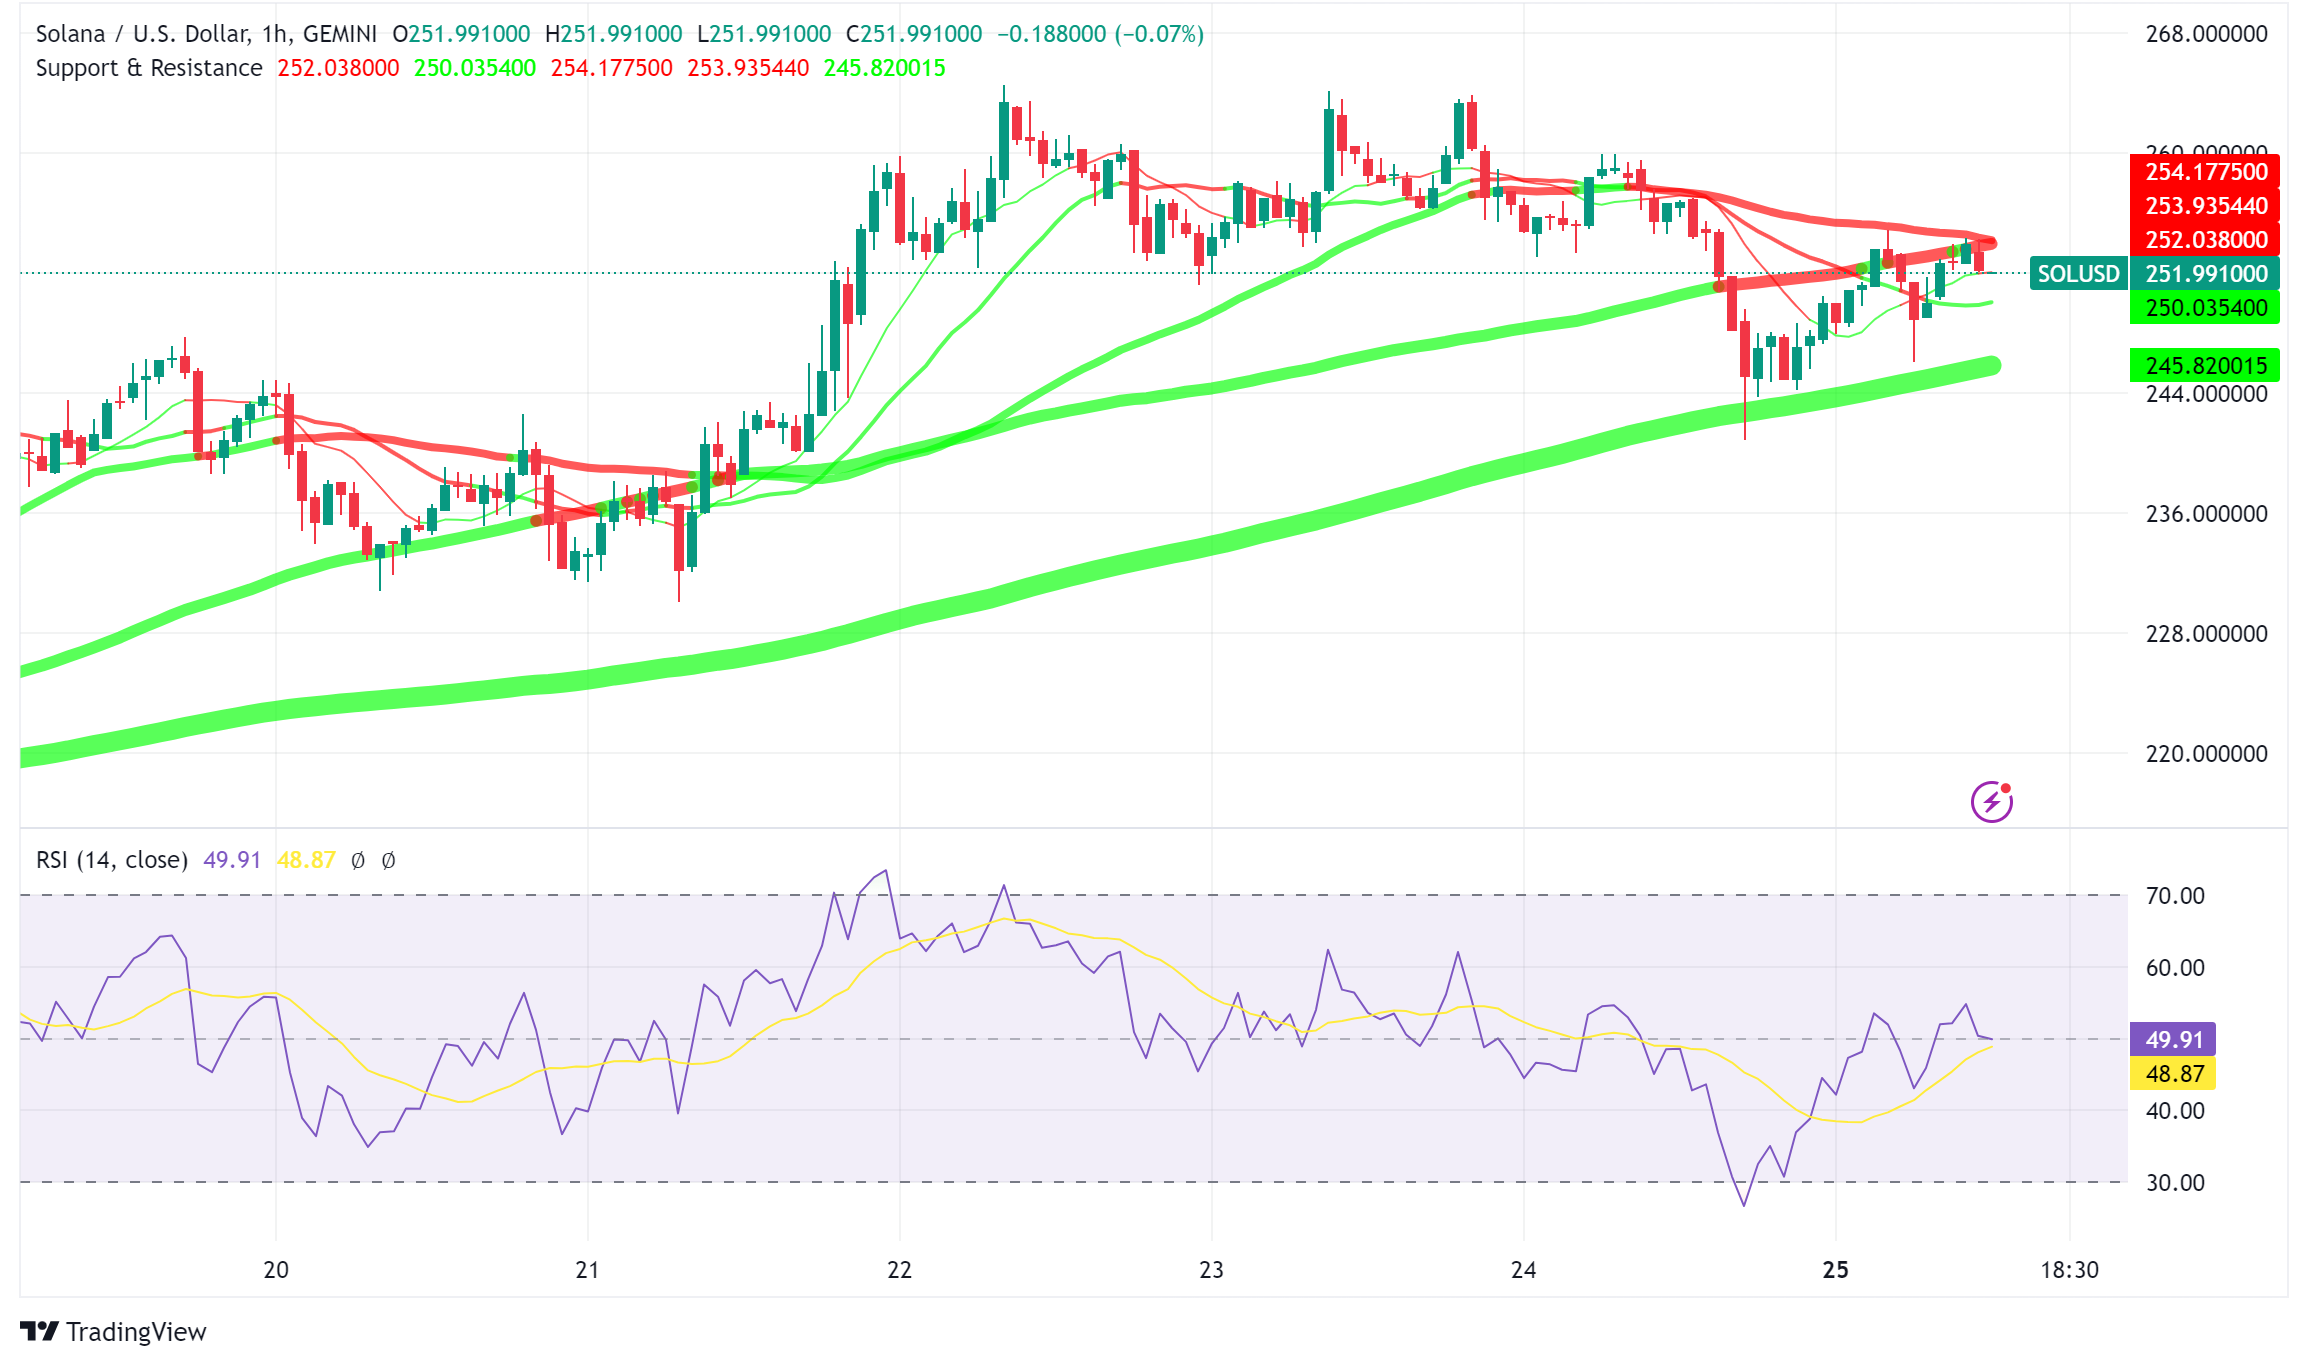
SOL/USD Technical Analysis Indicates a Positive Trend
A bullish pennant formation on the four-hour timeframe is revealed by technical analysis, indicating that SOL may be getting ready for another move up. If the breakout occurs, the pattern, which is usually seen as a continuation indication, suggests a possible 15% increase toward the $299 level.
The current price action shows that Solana price is currently consolidating close to its all-time highs under the key $260 level, with strong support at $244 and immediate resistance at $256. The Relative Strength Index (RSI) reading of 49 indicates potential for additional higher movement while preserving a sound market balance.
CoinGlass Metrics Display Contradictory Signals
However, some intriguing changes in trading positioning can be seen in recent Coinglass data:
- A 3.5% drop in open interest indicates some position unwinding.
- The lowest and upper bounds of the key liquidation levels are $251.2 and $264.1, respectively.
- The upswing is still well supported by the 200-day Exponential Moving Average.
- Check out our free forex signals
- Follow the top economic events on FX Leaders economic calendar
- Trade better, discover more Forex Trading Strategies
- Open a FREE Trading Account
Related Articles
Comments
Sidebar rates
Related Posts
