WTI Crude Oil Price Forecast: $66.90 Faces Pressure from Weak Demand
Oil prices face bearish pressure as weak Chinese demand and surplus forecasts offset geopolitical risks. Key levels suggest limited upside f

Oil prices edged higher early this week as heightened geopolitical tensions injected uncertainty into energy markets.

However, gains were short-lived as weak demand from China, the world’s second-largest oil consumer, and a forecasted global surplus weighed heavily on sentiment.
Russian airstrikes on Ukraine caused significant infrastructure damage, yet oil exports from Russia remain largely unaffected. Analysts suggest that should Ukraine escalate its targeting of Russian oil infrastructure, it could lead to a sharp rise in global oil prices.
ANALYST VIEWS #WTI
"Crude Oil (WTI) may fall to 66.00 – 66.60"
TECHNICAL ANALYSIS
Support: 66.60, 66.00, 65.40
Resistance: 67.80, 68.60, 69.40 pic.twitter.com/wAGpKx11xi— ICM.com Malaysia (@icmcapitalmy) November 18, 2024
Additionally, geopolitical risks were compounded by changes in U.S. policy allowing Ukraine to use advanced weaponry in its conflict with Russia, raising concerns about broader escalations. While these tensions temporarily propped up prices, the long-term outlook remains clouded by fundamental weaknesses.
Demand Worries Weigh on Oil Markets
China’s economic slowdown continues to dampen oil demand, with refinery throughput falling by 4.6% in October compared to the previous year. Lower factory output and sluggish economic activity further point to reduced energy consumption. This slowdown comes as the International Energy Agency projects a global oil surplus of more than 1 million barrels per day by 2025, even with OPEC+ production cuts.
In the U.S., the number of active oil rigs fell to 478 last week, marking the lowest count since mid-July. This reflects reduced domestic production in response to weaker demand and ongoing price uncertainty. Together, these factors are reinforcing bearish sentiment across the energy sector.
Technical Outlook: WTI Crude Oil Under Pressure
WTI crude oil prices are trading at $66.90, maintaining a bearish bias below the key pivot point of $67.11. Immediate support levels are seen at $66.31, with further downside targets at $65.79 and $65.25 if selling intensifies. Resistance lies at $67.69, with subsequent levels at $68.55 and $69.20 likely to cap any recovery attempts.
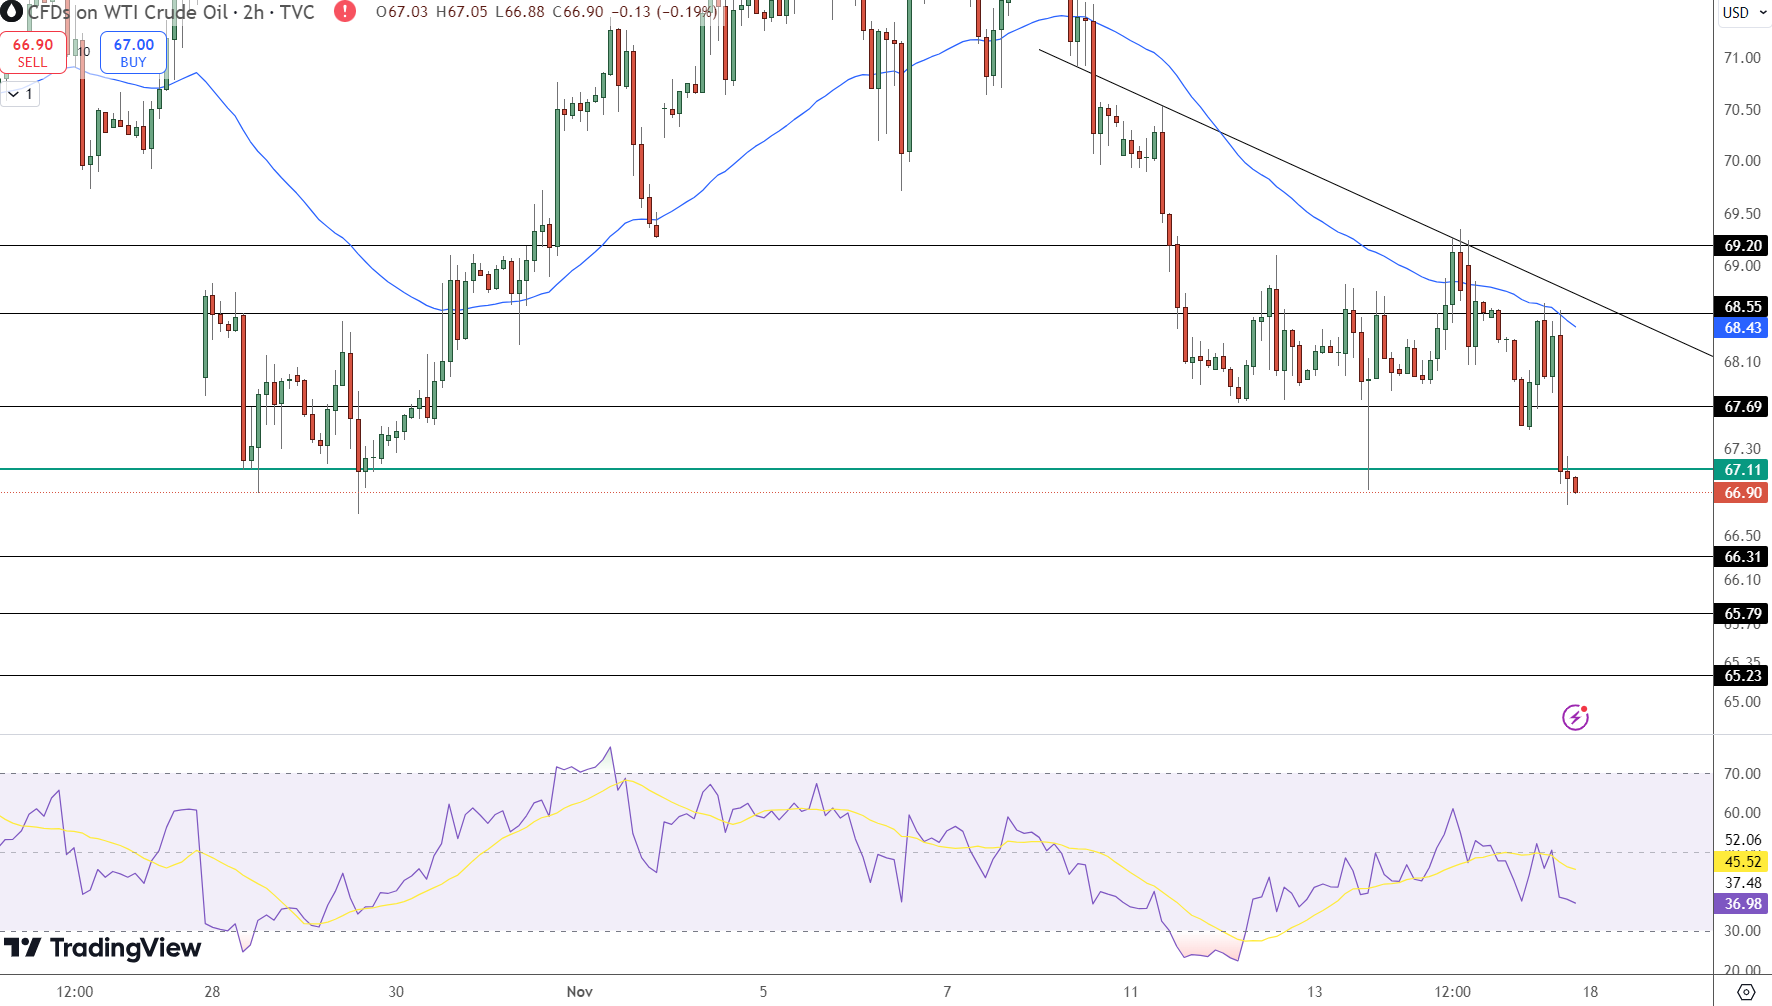
The RSI on the 2-hour chart at 36.98 suggests oversold conditions, offering potential for a short-term rebound. However, the 50-EMA at $68.43 and 200-EMA at $69.65 indicate a firm downtrend.
- Check out our free forex signals
- Follow the top economic events on FX Leaders economic calendar
- Trade better, discover more Forex Trading Strategies
- Open a FREE Trading Account
Related Articles
Comments
Sidebar rates
