Forex Signals Brief November 15: UK GDP and US Retail Sales Close the Week
Yesterday FED’s Powell shuffled markets late in the day, while today we have the UK GDP report and US retail sales which will close the week, however, they’re unlikely to change the bullish trend of the USD.

Yesterday the Australian employment report started the day, which leaned on the soft side again, keeping the Aussie retreating. In Europe, the Q3 Eurozone GDP came as expected, showing a 0.4% expansion, but the industrial production declined, which sent EUR/USD below 1.05, however, we saw a 1 cent jump in the US session, as the USD started retreating, despite the higher PPI inflation and lower Unemployment Claims.
During the U.S. session, the dollar had been trending downward until Federal Reserve Chairman Jerome Powell shifted the tone with a speech, stating that the economy is not signaling any urgency to lower rates. This statement appeared aimed at reducing the probability of a December rate cut, which had dropped from 85% at the start of the week to 60%.
Powell’s comments align with remarks from other Fed officials earlier in the week, who pointed to persistent inflation risks and resilient U.S. growth. Following these statements, the USD strengthened, causing declines in other major currencies. Gold, meanwhile, held onto its earlier gains, suggesting that its recent downtrend could be finding a bottom.
Today’s Market Expectations
Today started with data from Japan. Japan’s Q3 GDP showed modest growth, with annualized GDP at 0.9% exceeding expectations, while private consumption rose notably to 0.9%, indicating stronger consumer spending. Capital expenditures and external demand, however, fell short, pointing to mixed economic momentum. Meanwhile, Finance Minister Kato affirmed Japan’s commitment to stabilize FX markets against excessive or speculative movements, aiming for rates aligned with economic fundamentals.
After that we had she economic figures from China. China’s October data reveals resilient economic activity, with retail sales surpassing expectations at 4.8% (vs. 3.8% forecast) and reflecting strong consumer demand. Industrial production, however, grew at a slightly slower-than-expected pace of 5.3%, hinting at challenges in manufacturing. The unemployment rate edged down to 5.0%, suggesting stability in the labor market. These indicators collectively show a mixed but stable economic landscape, with consumer strength helping balance out industrial sector softness.
In the UK, GDP growth for September is expected to increase by 0.2% on a month-over-month basis, matching the gain reported for August. This follows two prior months of zero growth. Meanwhile, the three-month GDP figure has softened, moving from 0.5% to 0.2%. Monthly GDP figures can be volatile, but as noted by ING, recent economic data is pointing toward a relatively stable path. The September S&P Global report also reflected a decline in both services and manufacturing sectors, but both sectors remain in growth territory, suggesting the UK economy could achieve a soft landing.
The US retail sales outlook for this month shows slight adjustments across different measures. Excluding autos, the month-over-month measure is anticipated to be 0.3%, lower than the previous 0.5%. The broader retail sales M/M figure is also expected at 0.3%, down from 0.4%. The Control Group figure, which will be the main focus, is projected at 0.3%, a decrease from the previous 0.7%. Overall, consumer spending has held steady thanks to a strong labor market and positive real wage growth. Supporting this steady trend, the University of Michigan Consumer Sentiment index has continued its upward movement, indicating that consumers’ financial situations are either stable or improving.
Yesterday the trump trades were unwinding some of the gains, and the USD was retreating during most of the day, so we got caught on the wrong side of the market with 3 trades, but made up for it with 6 winning forex signals, as we had 9 closed trading signals during the day. The volatility was low until Jerome Powell made the hawkish comments, which sent the USD surging again, while stock markets tumbled.
Gold Decline Stalls at the 100 Daily SMA
In the gold market, prices have generally continued their bullish trend in 2024, extending a rise of over 50% since November 2022 when they hit a low of $1,600. However, recent weeks have seen a pullback, with prices dropping to $2,610 on Monday, a potential sign of a bearish reversal. This reversal became more apparent when gold failed to maintain levels above $2,700 after the U.S. election, and a further break below $2,600 could indicate continued declines. Gold prices have now dipped below the 50-day simple moving average, hinting at possible downward pressure despite the broader bullish momentum.
XAU/USD – Daily Chart
NZD/USD Comes Back to the 0.5850 Support
In the foreign exchange markets, the NZD/USD pair has been trading within a narrow five-cent range throughout the year. Sentiment for this pair turned bearish when it was unable to overcome the upper resistance between 0.6370 and 0.6380, and this was underscored by a decline below 0.59. Following a steep four-cent decline in October that took the pair below 0.60, there was a brief recovery after the U.S. presidential election. However, the pair remains weighed down by market disappointment over China’s stimulus package, which was seen as inadequate, and the broader risk-off mood affecting commodity-linked currencies. The dovish shift by the Reserve Bank of New Zealand, along with weak economic data from both China and New Zealand, has limited optimism for NZD buyers. If the pair falls below the 0.5850 support level, it could continue its descent toward 0.5770, a key low reached in 2023.
NZD/USD – Daily Chart
Cryptocurrency Update
Bitcoin Retreats Below $90K Again
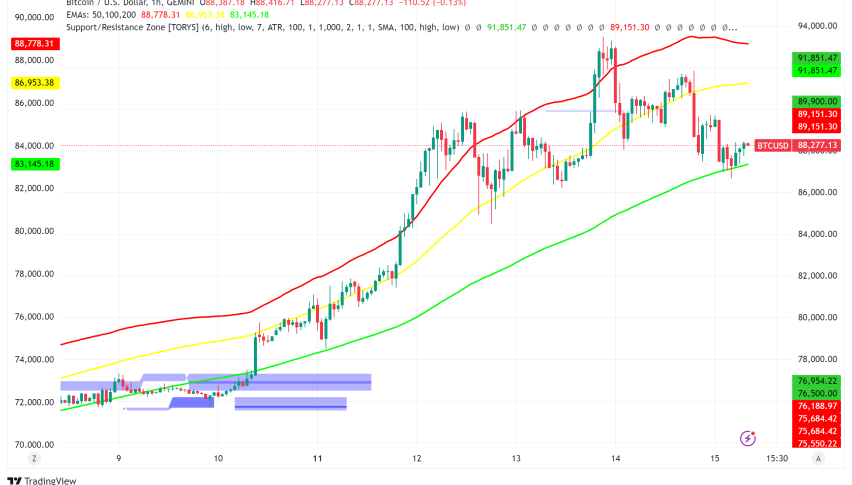
Cryptocurrency markets have also shown dynamic movements. Bitcoin, after declining during the summer from above $70,000 to just over $50,000, bounced back post-election, reaching $93,500 on Wednesday and inching closer to the $100,000 mark. However, yesterday we saw a pullback which was due after such a strong rally and BTC slipped below $88K.
BTC/USD – Daily chart
Ethereum Holds Above $3,000
Ethereum, too, has regained its bullish momentum. Following a dip below $2,500, Ethereum broke above the 50-day simple moving average, climbing to $3,450 before experiencing a minor pullback. Both Bitcoin and Ethereum are showing signs of investor optimism, although they remain vulnerable to market corrections.
ETH/USD – Daily chart


