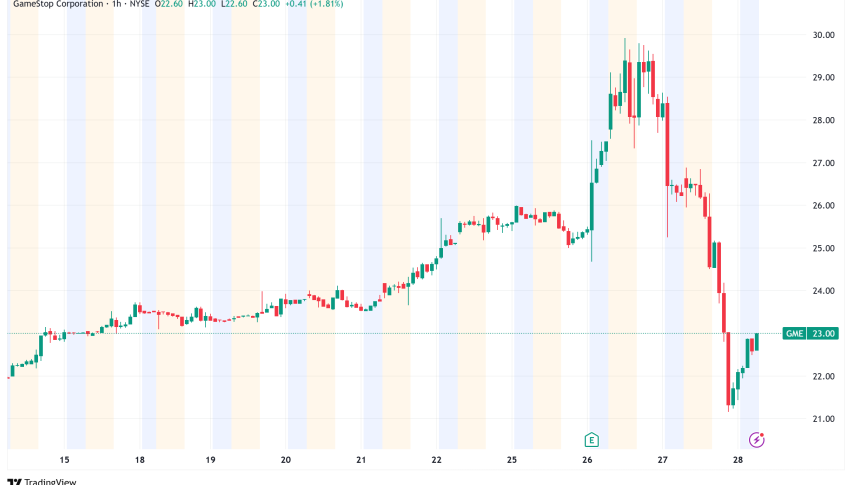
GameStop Corp. (GME): Is a Bullish Rally on the Horizon?

Over the past five months, GameStop Corp. (GME) has demonstrated resilience by maintaining its position above the critical 50-month EMA support at $21.22. This level has proven to be a robust foundation, suggesting that the bearish momentum may be fading and setting the stage for a potential bullish reversal.
GameStop (GME) Stock: Bearish Momentum Diminishes
GameStop (GME) has been in a corrective movement over the past five months, since GME failed to break the 0.382 Fib resistance at $52.25. However, the bearish momentum dies out, as volatility withrawals and GME successfuly holds above the 50-month-EMA.
Key Technical Indicators (Monthly Chart)
- MACD: The MACD lines remain bullishly crossed, signaling underlying bullish momentum despite recent consolidation. However, it’s important to note that the histogram has been ticking lower in recent months, indicating a weakening of this momentum. A reversal in the histogram would be an early signal of renewed bullish strength.
- RSI: The Relative Strength Index (RSI) is currently hovering in neutral territory, neither overbought nor oversold. This indecision reflects the current consolidation phase but leaves room for a potential move in either direction. A break above 60 on the RSI could signal the start of a new bullish trend.
- EMAs: The golden cross of the EMAs (where shorter-term EMAs cross above longer-term EMAs) confirms a longer-term bullish trend is still intact. As long as GME holds above the 50-month EMA, there remains significant upside potential.
 GameStop
GameStop Has Broken The Series Of Lower Highs
GameStop has recently broken its series of lower highs, signaling a potential shift in market sentiment. The stock successfully broke out of a symmetrical triangle pattern, a key technical formation that often precedes significant price movements. Notably, several key indicators on the weekly chart are starting to flash bullish signals, suggesting a possible reversal in the trend.
Technical Indicators and Trends (Weekly Chart)
- MACD: The MACD histogram has been ticking bullishly higher, with the MACD lines approaching a bullish crossover. This shift in momentum could mark the start of upward pressure in the stock price.
- RSI: The RSI remains in neutral territory, not yet signaling overbought or oversold conditions, but its consolidation within this range provides the stock room to move higher without facing immediate resistance.
- EMAs: The exponential moving averages (EMAs) are on the verge of forming a Golden Crossover, a significant bullish signal that, if confirmed, could indicate a mid-term trend reversal to the upside.

GameStop (GME) Potential Upside of Up to 56%
GameStop stock (GME) presents a significant upside potential. If the current bullish momentum continues, the stock could surge to the next key Fibonacci resistance level, approximately $36.3, representing a potential gain of up to 56%. Furthermore, it is a strong bullish signal that GameStop recently bounced off the 50-day EMA at $21.84, reinforcing its upward trajectory in the short term.
Technical Indicators and Trends (Daily Chart)
- EMA: The golden crossover of the exponential moving averages (EMAs) remains intact, indicating that the bullish trend is still in play for the short to medium term.
- MACD: The MACD histogram is ticking bullishly higher, and the MACD lines have crossed bullishly, further signaling upward momentum.
- RSI: The relative strength index (RSI) remains neutral, neither indicating overbought nor oversold conditions, which leaves room for the stock to continue its upward movement without immediate risk of reversal.
With these strong technical signals in place, GameStop could be well-positioned for a sustained rally, making the $36.3 Fibonacci level a realistic target. Traders should continue to monitor these indicators for confirmation of the trend.

More Bullish Signals in the 4H Chart for GameStop (GME)
The 4-hour chart for GameStop (GME) presents additional bullish signals, further reinforcing the stock’s upward momentum. The recent Golden Crossover of the EMAs confirms a bullish trend in the short term, signaling potential further gains. The MACD lines have also crossed bullishly, with the histogram trending upwards, indicating growing buying pressure.
Additionally, the RSI is approaching overbought levels but has yet to show any bearish divergence, suggesting that upward momentum could continue without immediate reversal.

Summary
The technical indicators paint a bullish scenario for GME in the short to medium term. The stock currently sits above a critical support level, which, if held, could serve as a launchpad for a potential rally. Most indicators signal a decrease in downward pressure, but careful monitoring of price action around key resistance levels will be essential to confirm the next move.
This bullish setup suggests that GME could continue to build momentum, with a potential upward target of approx. $36.3.
- Check out our free forex signals
- Follow the top economic events on FX Leaders economic calendar
- Trade better, discover more Forex Trading Strategies
- Open a FREE Trading Account


