Forex Signals Brief November 6: Quiet Calendar after US Elections
Today the economic calendar is pretty light, so traders will focus more on the US presidential election aftermath. Yesterday the day started with the Reserve bank of Australia meeting, which held the Cash Rate unchanged once again at 4.35%, while giving the market the idea that they’re not cutting anytime soon. So, this was a hawkish meeting after all, which supported the Aussie, sending AUD/USD 60 pips higher yesterday, also helped by the retreat in the USD on election day.

The New Zealand employment report was released last night, with the unemployment rate rose from 4.6% in Q2 to 4.8% in Q3, slightly better than the expected 5.0%. The participation rate dipped to 71.2%, just below the forecast of 71.5%, and employment fell by 0.5%, close to the expected 0.4% decrease, following a 0.4% increase in Q2. The labor cost index dropped by 0.6% in Q3, contrary to expectations of a 0.7% rise, after a 0.9% decline in Q2.
Overall, New Zealand’s Q3 employment data points to a weakening labor market, with both rising unemployment and a notable drop in labor costs. Although the participation rate remains relatively steady, lower-than-anticipated employment and wage growth suggest slower economic momentum, potentially heightening concerns around consumer spending and economic resilience heading into the final quarter.
Today’s Market Expectations
Today started with the Q3 employment report from New Zealand which was expected to show a 4 point jump in the unemployment rate from 4.6% to 5%. The unemployment rate rose from 4.6% in Q2 to 4.8% in Q3, slightly better than the expected 5.0%. The participation rate dipped to 71.2%, just below the forecast of 71.5%, and employment fell by 0.5%, close to the expected 0.4% decrease, following a 0.4% increase in Q2.
The labor cost index dropped by 0.6% in Q3, contrary to expectations of a 0.7% rise, after a 0.9% decline in Q2. Overall, New Zealand’s Q3 employment data points to a weakening labor market, with both rising unemployment and a notable drop in labor costs. Although the participation rate remains relatively steady, lower-than-anticipated employment and wage growth suggest slower economic momentum, potentially heightening concerns around consumer spending and economic resilience heading into the final quarter.
We also have the Central Bank of Brail meeting today. Following a 25 basis point increase in its Selic rate in September, Brazil’s central bank is projected to raise rates by 50 basis points in November, bringing it to 11.25%. In a Reuters poll, only four out of 30 respondents expect a smaller 25bps adjustment, while most anticipate a larger increase due to a tighter labor market and stronger-than-expected economic growth. Rising costs, compounded by pressure on the BRL and global uncertainties, continue to challenge the central bank, but Copom officials remain committed to the 3% inflation target. Another rate hike is broadly expected in December. While the Selic rate is predicted to drop to 11.25% by the end of 2025, the central bank’s survey of economists suggests it could rise to 11.75% by the close of this year.
Yesterday the USD retreat continued and we went with the flow, being short on the USD, which was a good trading strategy and resulted in some good trades. We opened seven trading signal in total, closing the day with 6 closed trades, all of which were winning forex signals.
Gold Trading Between MAs
In 2024, gold prices have surged nearly 35%, climbing from $2,000 to around $2,800, driven by economic instability and technical signals. However, volatility has increased as the U.S. presidential election approaches. Recently, a gold sell signal emerged when prices neared the 100 SMA on the H1 chart, where this moving average acted as resistance and supported a profitable sell position as prices reversed downward however it kept trading between these 2 MAs. 
XAU/USD – H4 Chart
USD/CAD Found Support at the 100 SMA
In the currency market, despite Canada’s economic slowdown and widening trade deficit, the USDCAD pair dropped by one cent this week, largely influenced by the upcoming U.S. election. Currently, buyers have reappeared at the 100 SMA level on the H4 chart, although momentum has stalled as traders await election results.
USD/CAD – H4 Chart
Cryptocurrency Update
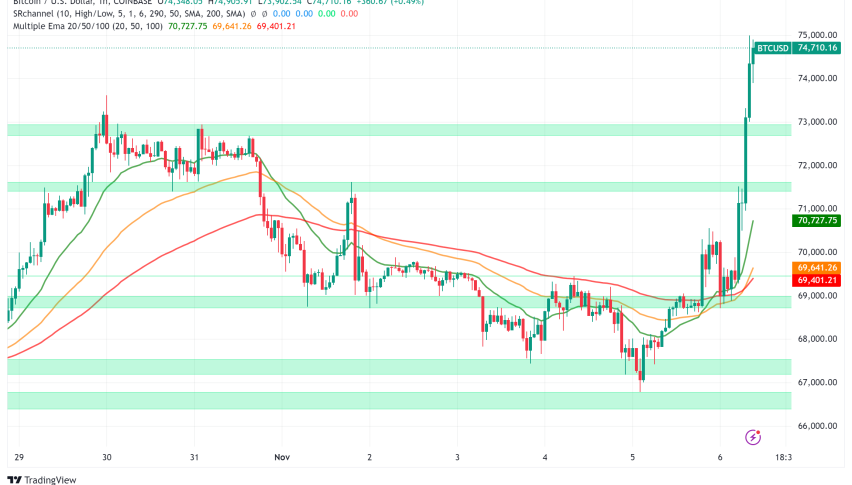
Bitcoin Returns to $70K Again
Bitcoin has experienced high volatility this year, dropping from over $70,000 in April to around $50,000. A surge from $65,000 to above $70,000 followed the Federal Reserve’s rate cut in September, but Bitcoin faced a pullback to $67,500 before rebounding toward $70,000. Nonetheless, it fell again after failing to breach this high but once again returned to 70K yesterday.
BTC/USD – Daily chart
Ethereum Falls Below $2,500
Ethereum has also shown strong buying momentum, recently rising past $2,700 after surpassing its 100-day SMA. It briefly dipped below $2,500 but regained support above the 50-day SMA, reinforcing its upward trend until another decline below $2,500 over the weekend.
ETH/USD – Daily chart
🏆 7 Best Forex Brokers
| Broker | Website | |
|---|---|---|
| 🥇 |  | Visit Broker |
| 🥈 |  | Visit Broker |
| 🥉 |  | Visit Broker |
| 4 |  | Visit Broker |
| 5 |  | Visit Broker |
| 6 |  | Visit Broker |
| 7 |  | Visit Broker |


