Selling AUDUSD As It Falls Below 0.66 on US Economic Acceleration
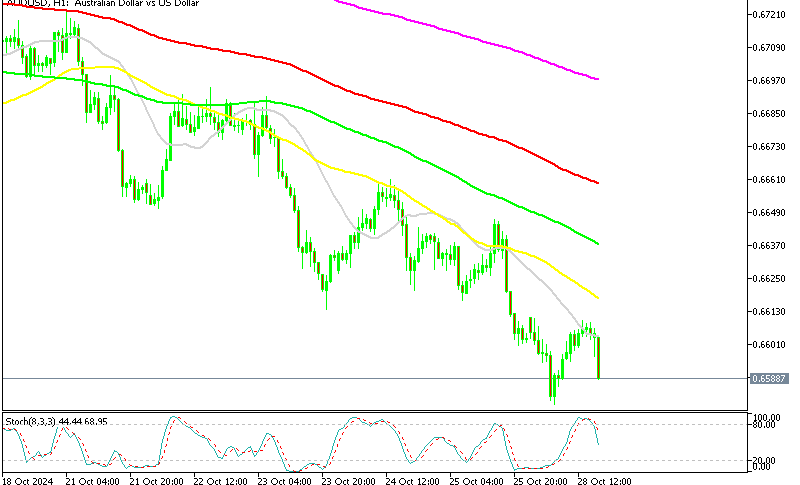
In the European session, AUDUSD was retracing higher and climbed above 0.66, but sellers returned once the retrace was complete on the H1 chart. Today AUD/USD opened on a bearish foot, slipping below 0.66, as the USD continued the price action from last week, pushing higher. But, the retrace was over and we decided to open a sell AUD/USD signal.
AUD/USD Chart H1 – MAs Helping Keep It Bearish Amid Strong USD and Negative Risk Sentiment
The AUD/USD pair has experienced a steady decline this month, losing over 3.5 cents due to a stronger U.S. dollar and reduced appetite for commodity-linked currencies like the Australian dollar. Although the Reserve Bank of Australia (RBA) has maintained a relatively hawkish stance by keeping the Cash Rate on hold while other central banks have cut rates, this hasn’t prevented the AUD from recent losses.
China’s Disappointing Economic Data Weighs on the AUD
Australia’s currency has come under additional pressure from China’s lackluster fiscal and monetary stimulus, which has not met market expectations. Data released today by China’s National Bureau of Statistics (NBS) showed a 27.1% year-over-year decline in industrial profits for September, marking the steepest monthly drop this year and following a 17.8% fall in August. From January to September, profits decreased by 3.5%, reversing a 0.5% gain through August. NBS attributes the decline to soft demand, lower producer prices, and a high base effect from August.
Despite the NBS’s hopeful outlook that new policy measures could foster a more favorable environment for Chinese industry and support profit recovery, the impact remains to be seen. For now, China’s economic challenges continue to weigh heavily on commodity-backed currencies, keeping the AUD under significant pressure.
Strong U.S. Economic Indicators Bolster the USD
Meanwhile, the U.S. dollar has been buoyed by a series of strong economic indicators, including last week’s Services and Manufacturing PMIs, and recent remarks from JPMorgan CEO Jamie Dimon. Dimon highlighted the resilience of the U.S. economy, remarking that it “is still booming.” His tempered outlook on inflation aligns with recent yield increases, suggesting inflation may be more persistent, which could limit Federal Reserve rate cuts and provide further support for the USD.
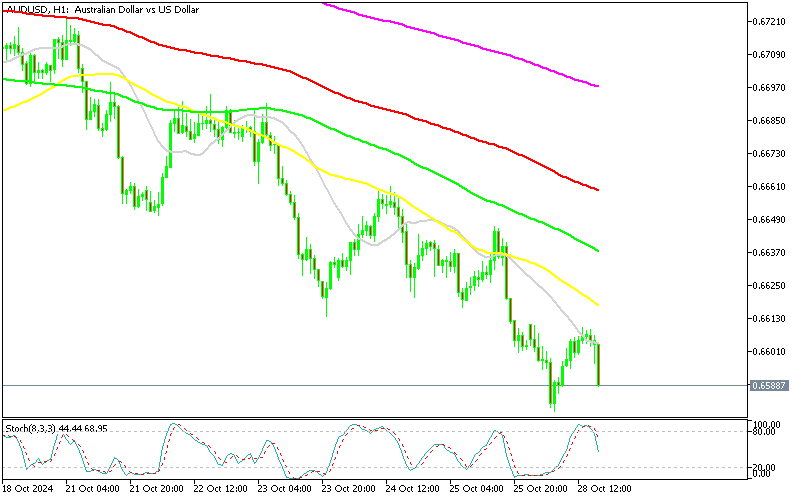
AUD/USD Live Chart
- Check out our free forex signals
- Follow the top economic events on FX Leaders economic calendar
- Trade better, discover more Forex Trading Strategies
- Open a FREE Trading Account
Related Articles


Comments
Sidebar rates
Related Posts
