


XRP Poised for Breakout? Key $0.5170 Resistance Meets Surging 510.7M Open Interest
Ripple is at $0.5154, up 1.02% in the last 24 hours. It’s hitting resistance from the downward trendline at $0.5170 which has been holding back any further up move.
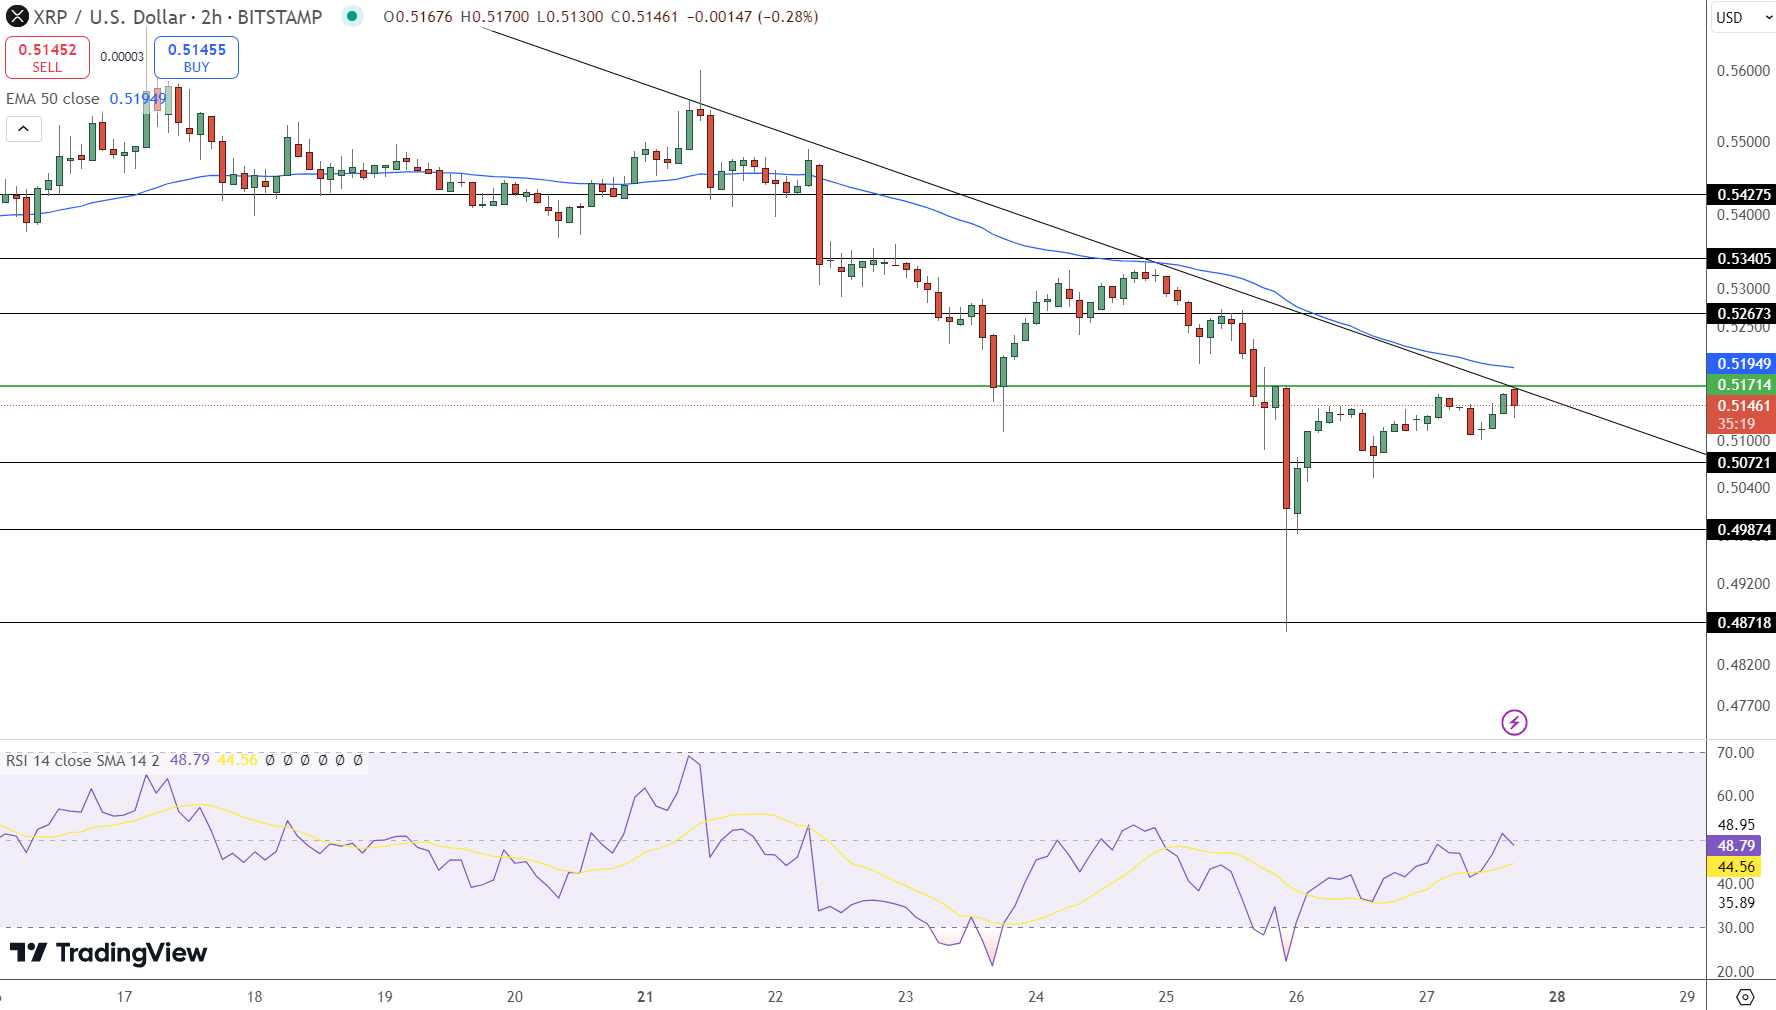
The 50 EMA at $0.5195 is also capping the upside on the 2 hour chart.
The RSI is at 48.79, just below the 50 mark. Not much buying momentum as the RSI is struggling to go above 50.
A strong buying impulse is needed to break above $0.5170 trendline and the 50 EMA at $0.5195. Otherwise, Ripple will be stuck in this range.
- Resistance Levels: Key resistance at $0.5170, followed by $0.5195 and $0.5265.
- Support Levels: Immediate support at $0.5100, with additional levels at $0.5072 and $0.4985.
Open Interest Rising, Major Move Ahead?
Open Interest is rising for XRP, 510.7 million across major exchanges. This means more and more traders are getting involved, both long and short, to position for a big move. Historically, high OI for XRP has preceded a big move, either up or down.
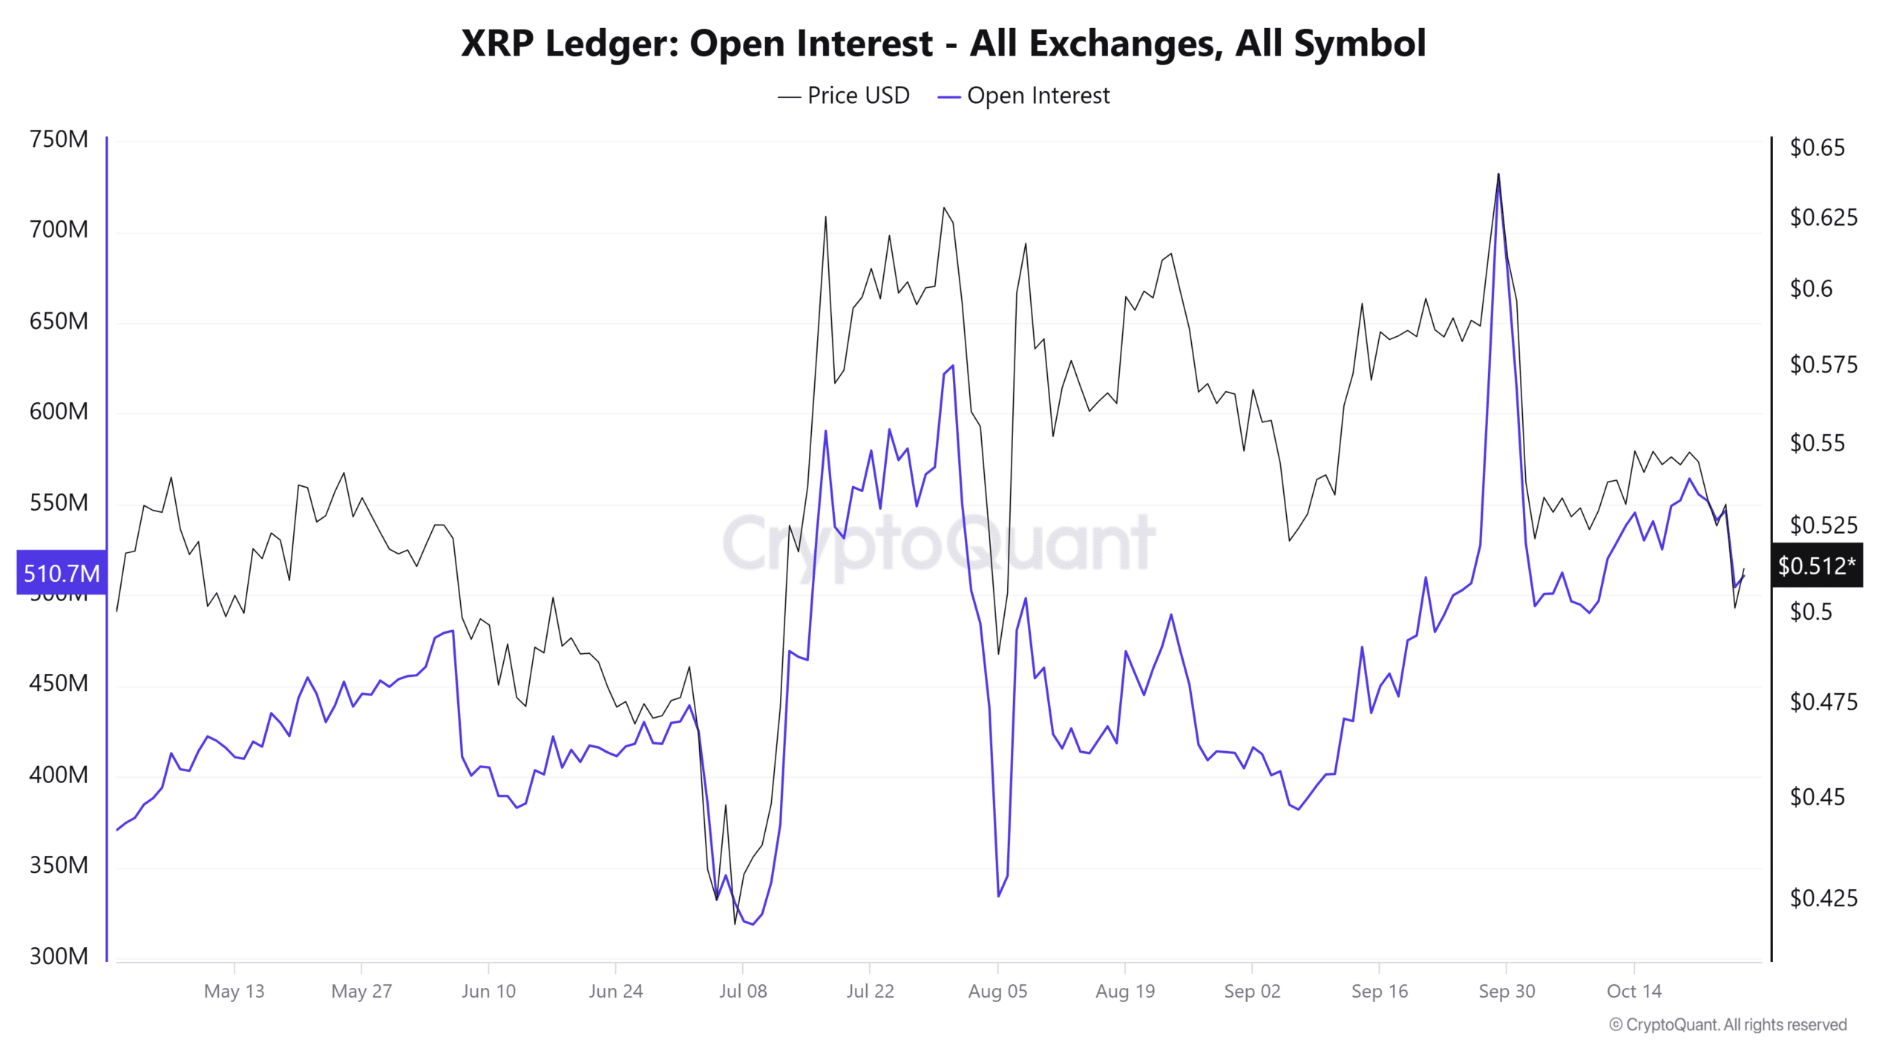
More OI means traders are expecting a big move. If XRP breaks above $0.5170, the OI could fuel a big upmove to $0.5265. If buying pressure fades, the OI could accelerate a down move to $0.5072 and $0.4985.
- Open Interest Insight: Elevated OI at 510.7 million indicates growing market activity.
- Volatility: High OI has led to big moves in XRP.
Summary: XRP Needs More Buying to Break Above Resistance
To go higher, XRP needs to break above $0.5170 and the 50 EMA at $0.5195. A sustained buying pressure can take it to $0.5265 which is the next resistance. But RSI is at 48, buyers are still cautious and without a clear breakout, XRP will be stuck in this range.
Open Interest rising adds to the volatility context, so these resistance and support levels are crucial in the coming days. Watch for any change in momentum and these technicals will be the guide.
- Key Takeaways: XRP faces strong resistance, rising OI suggests high market engagement, and RSI reflects limited buying momentum.
- Next Steps: Monitor resistance and support levels for any breakouts or breakdowns.


Sidebar rates
Related Posts
Add 3440

