Bitcoin Bullish Breakout Valid Despite Drop: Will BTC Reclaim $70,000?
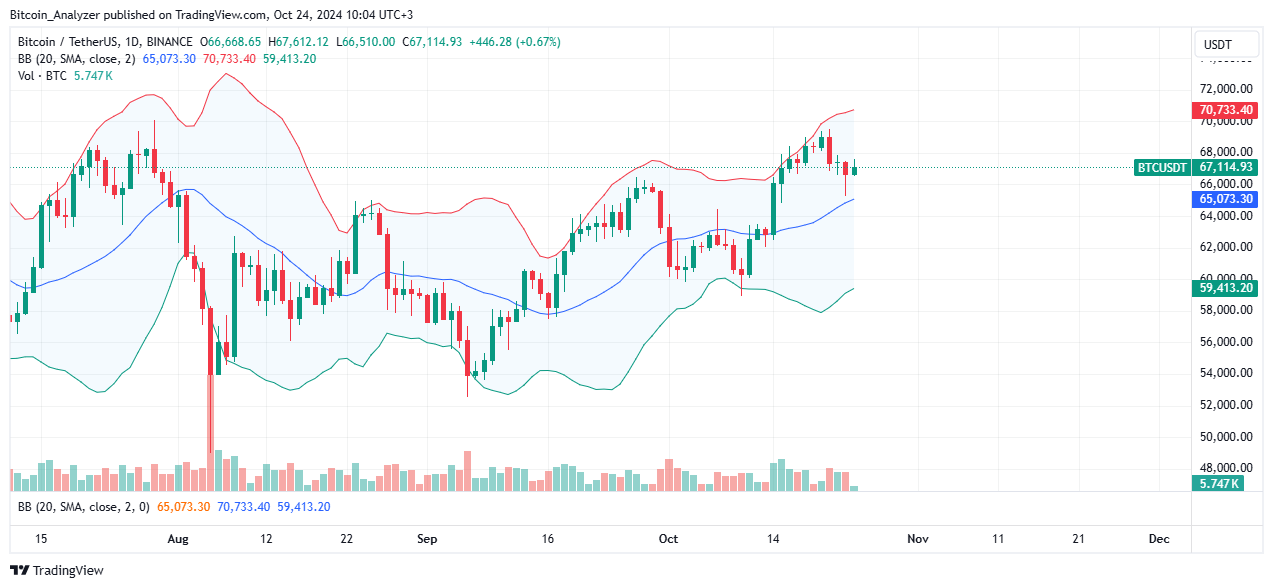
Bitcoin ended up trading lower yesterday. After the consolidation of October 22, prices fell, confirming losses of early this week. From the daily chart, sellers have the upper hand. This overview will remain until there is a satisfying recovery, lifting sentiment and prices from this week’s pits. Technically, a close above $66,000 by the end of the day would catalyze demand, but what’s truly needed is a leg up above $70,000. If this is the case, spurred by supportive fundamentals, Bitcoin can easily float to as high as $74,000 in a buy trend continuation formation.
The path of least resistance swings in favor of determined sellers, at least in the short term. Although some expect prices to rally, there is stiff resistance. In the past day, the world’s most valuable coin remained stable amid expanding trading volume, which stood at over $34 billion.

Traders are watching the following trending Bitcoin news:
- The market remains uncertain ahead of the United States General Election. A Donald Trump win, one analyst said, could see BTC rally– even breaking all-time highs.
- Despite the sell-off, Bitcoin is within a bullish breakout formation. Looking at the daily chart, the drop could turn out to be a retest. If prices find support from around August and September highs, bulls will likely push back toward $70,000.
Bitcoin Price Analysis
BTC/USD is under pressure, looking at price action in the daily chart.
Prices are cooling off after the strong leg up in the second half of September.
Even as prices drop, the uptrend remains. If anything, the coin is within a bullish breakout formation after the close above August highs.
If Bitcoin finds support at $66,000, prices can steadily recover, soaring to over $70,000 and all-time highs.
If not, sustained losses could push the world’s most valuable coin back to October lows of around $60,000.


