Nvidia Stock Bullish Breakout: Key Resistance Levels to Watch
The upcoming earnings report holds the potential to be a pivotal catalyst for the Nvidia stock's movement which is facing support.
Konstantin Kaiser•Tuesday, October 8, 2024•2 min read
Despite a downtrend since June, Nvidia (NVDA) has recently signaled a potential shift in momentum as the stock has broken out bullishly. This breakout suggests that a possible reversal is on the horizon, offering new opportunities for upward movement. Traders should closely watch key levels and indicators to confirm this bullish turn.

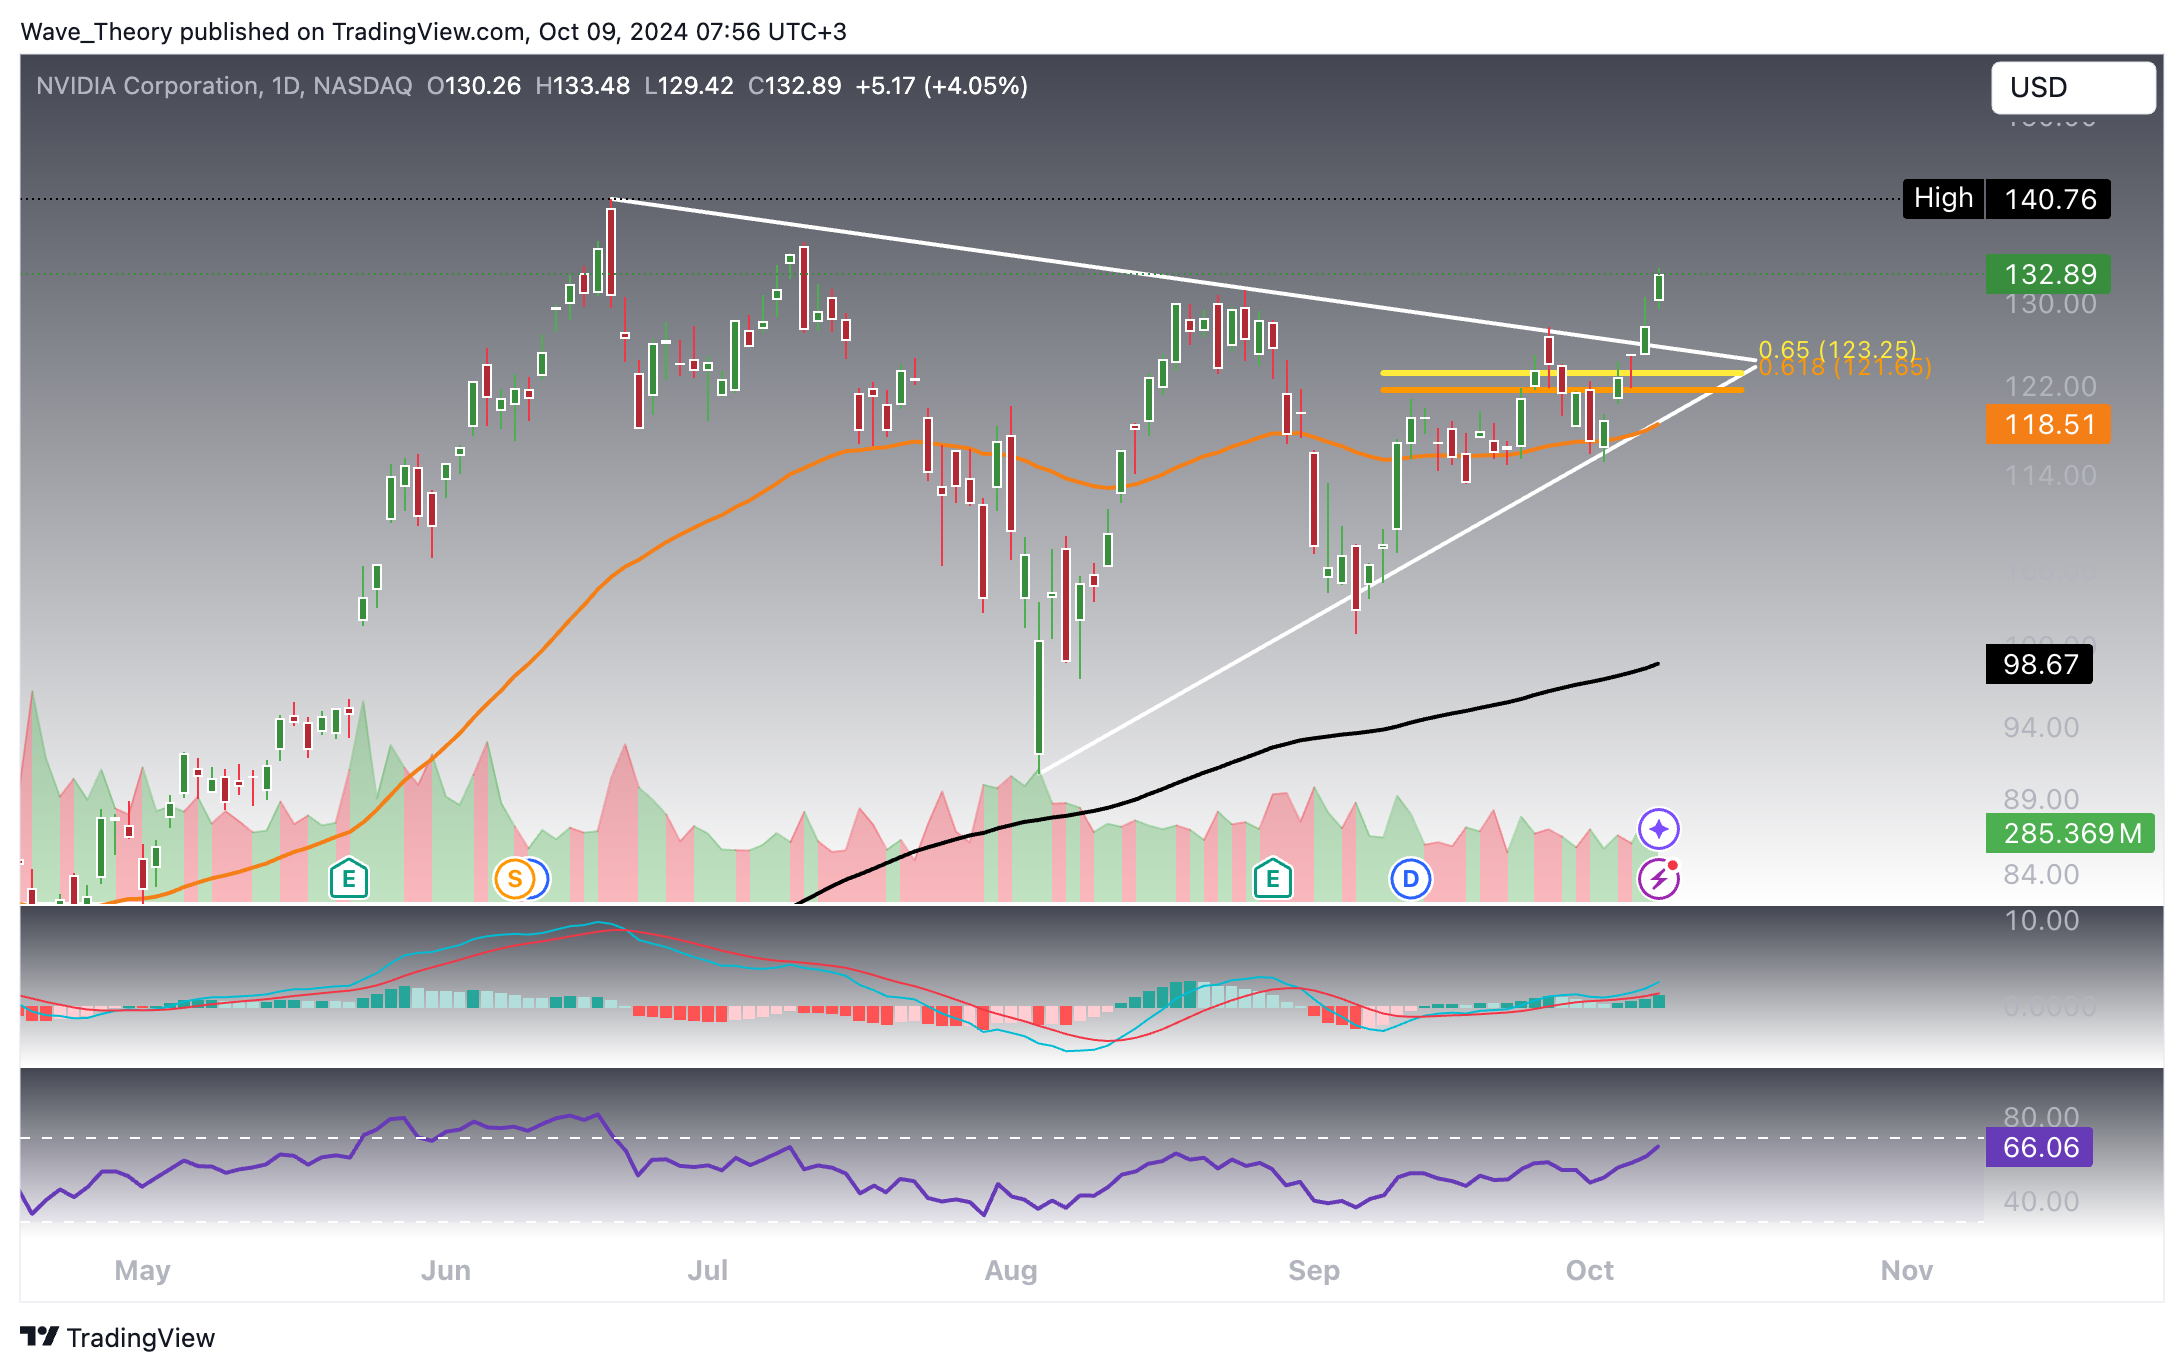
Nvidia (NVDA) has successfully broken the golden ratio resistance at $123, initiating a bullish breakout from the symmetrical triangle pattern. This move sets the stage for a potential surge toward the recent high of approximately $141. The daily chart’s technical indicators further support this bullish outlook.
Technical Indicators and Trends (Daily Chart)
- MACD (Moving Average Convergence Divergence): The MACD lines have crossed bullishly, with the histogram rising steadily over the past four days, signaling growing momentum.
- RSI (Relative Strength Index): The RSI is approaching overbought territory but remains in neutral regions, allowing for further upward movement.
- EMA (Exponential Moving Average): The golden crossover of the EMAs confirms a short- to medium-term bullish trend, reinforcing the positive trajectory for NVDA.
Despite the broader market correction, Nvidia appears poised for a serious attempt at breaching the last all-time high (ATH) near $141.
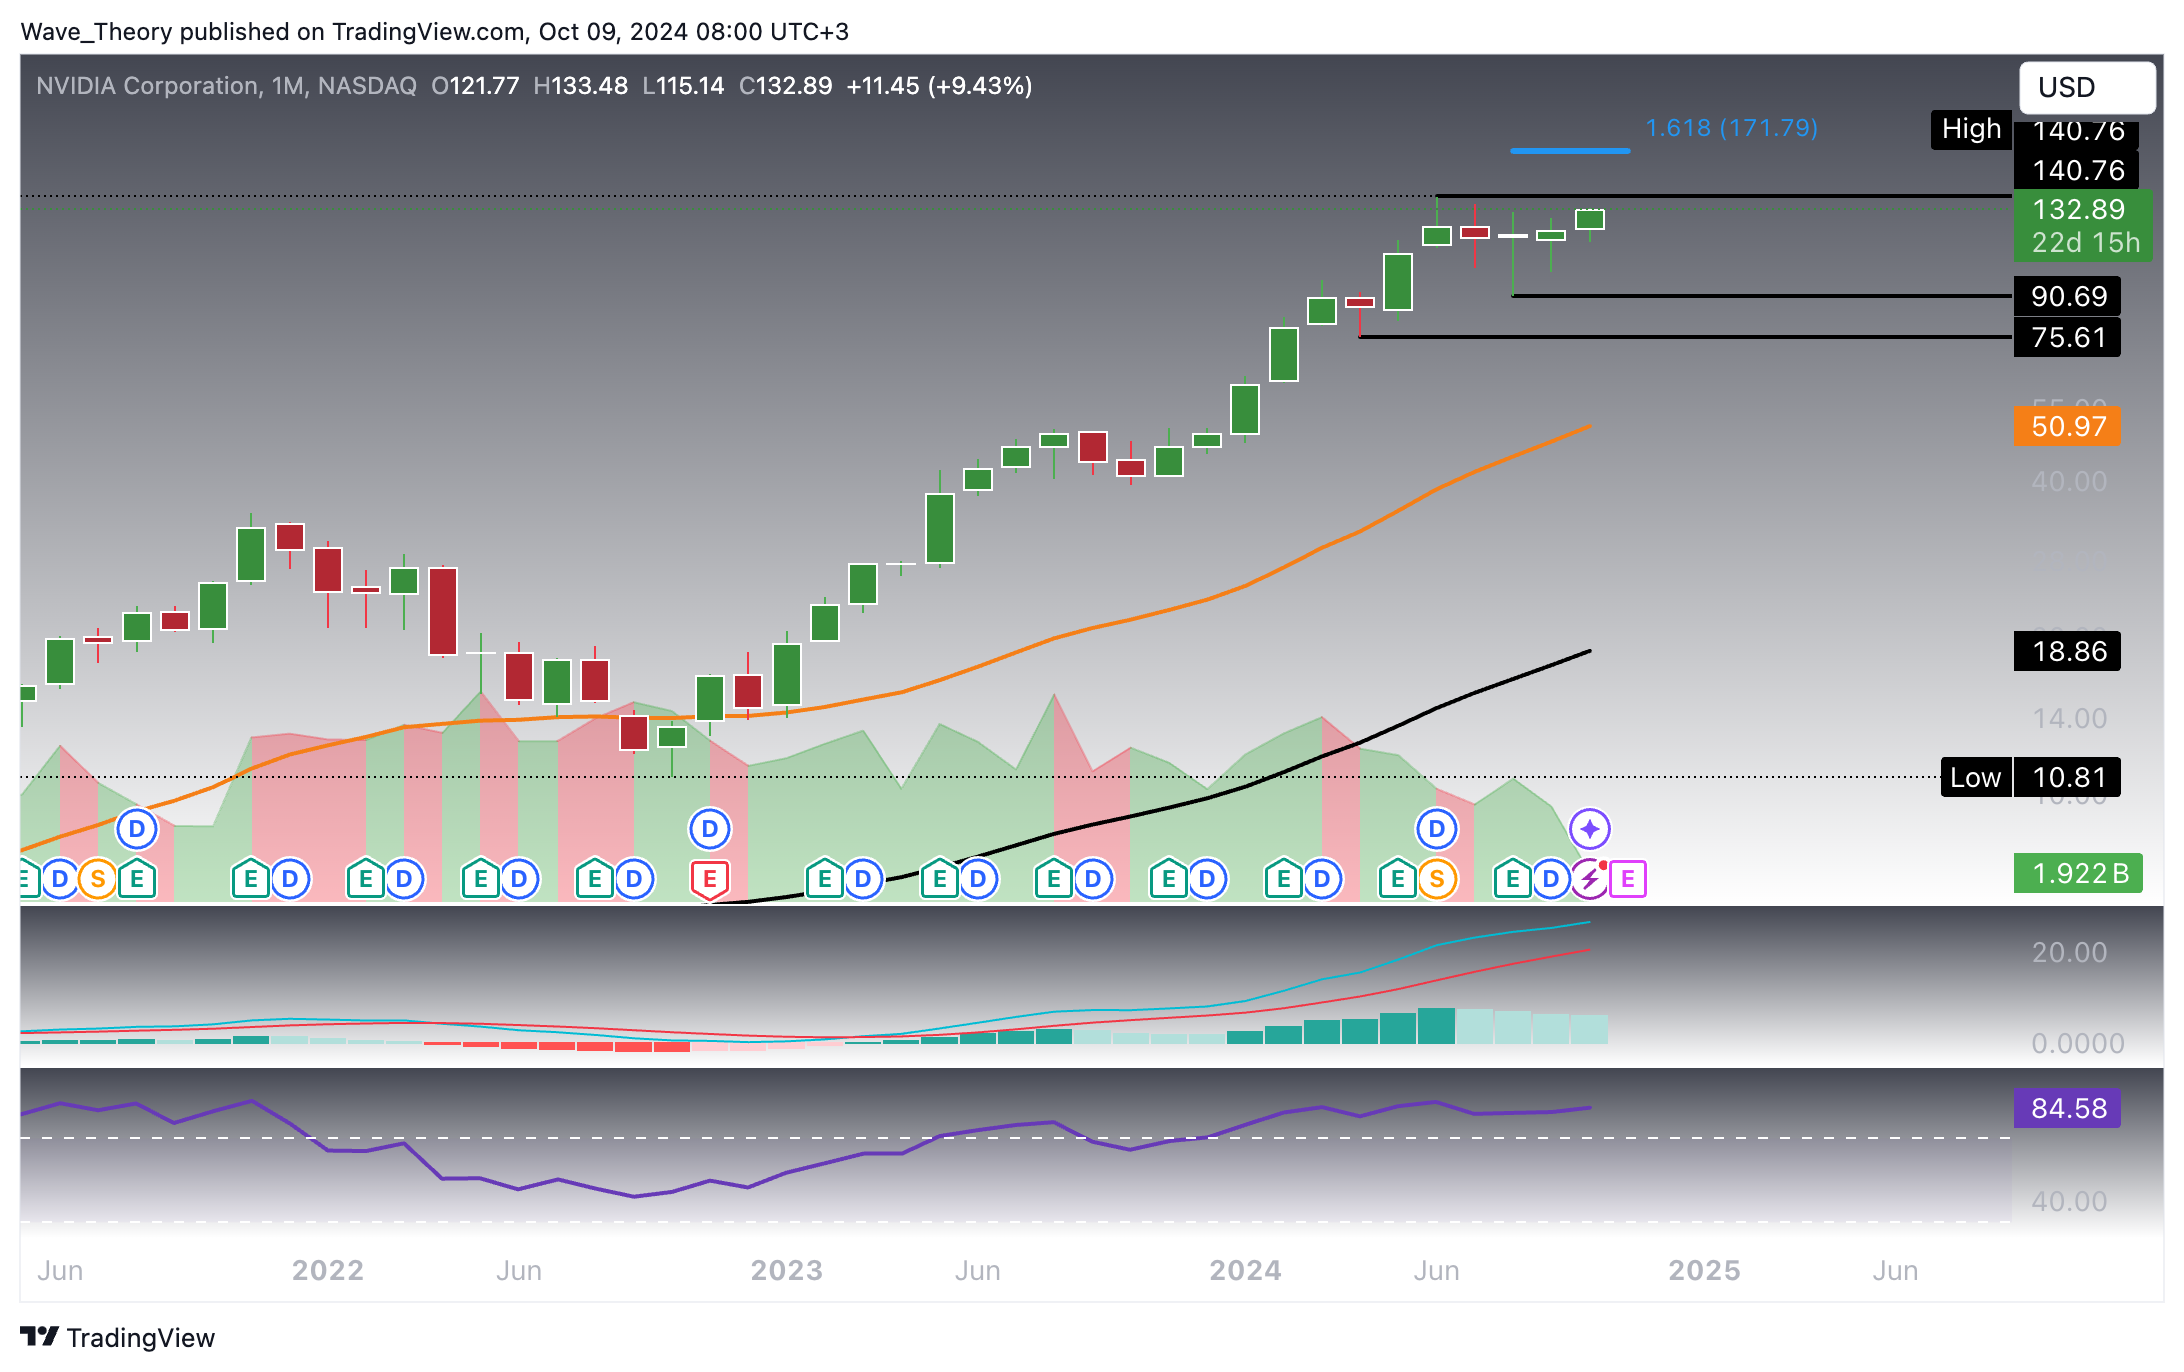
Currently, Nvidia (NVDA) stock has an upside potential of approximately 6%, aiming for the recent high at $141. However, if an unexpected correction occurs, the next significant Fibonacci support levels are at $117 and $106. The 4-hour chart’s indicators continue to signal bullish momentum in the short term.
Technical Indicators and Trends (4H Chart)
- MACD (Moving Average Convergence Divergence): The MACD remains in a bullish crossover and the histogram is trending higher, supporting a short-term bullish outlook.
- RSI (Relative Strength Index): The RSI is approaching overbought levels, suggesting the possibility of a pullback near the previous high at $141.
- EMA (Exponential Moving Average): The golden crossover of the EMAs confirms a short-term bullish trend, reinforcing a generally positive outlook for the stock.
 NVIDIA
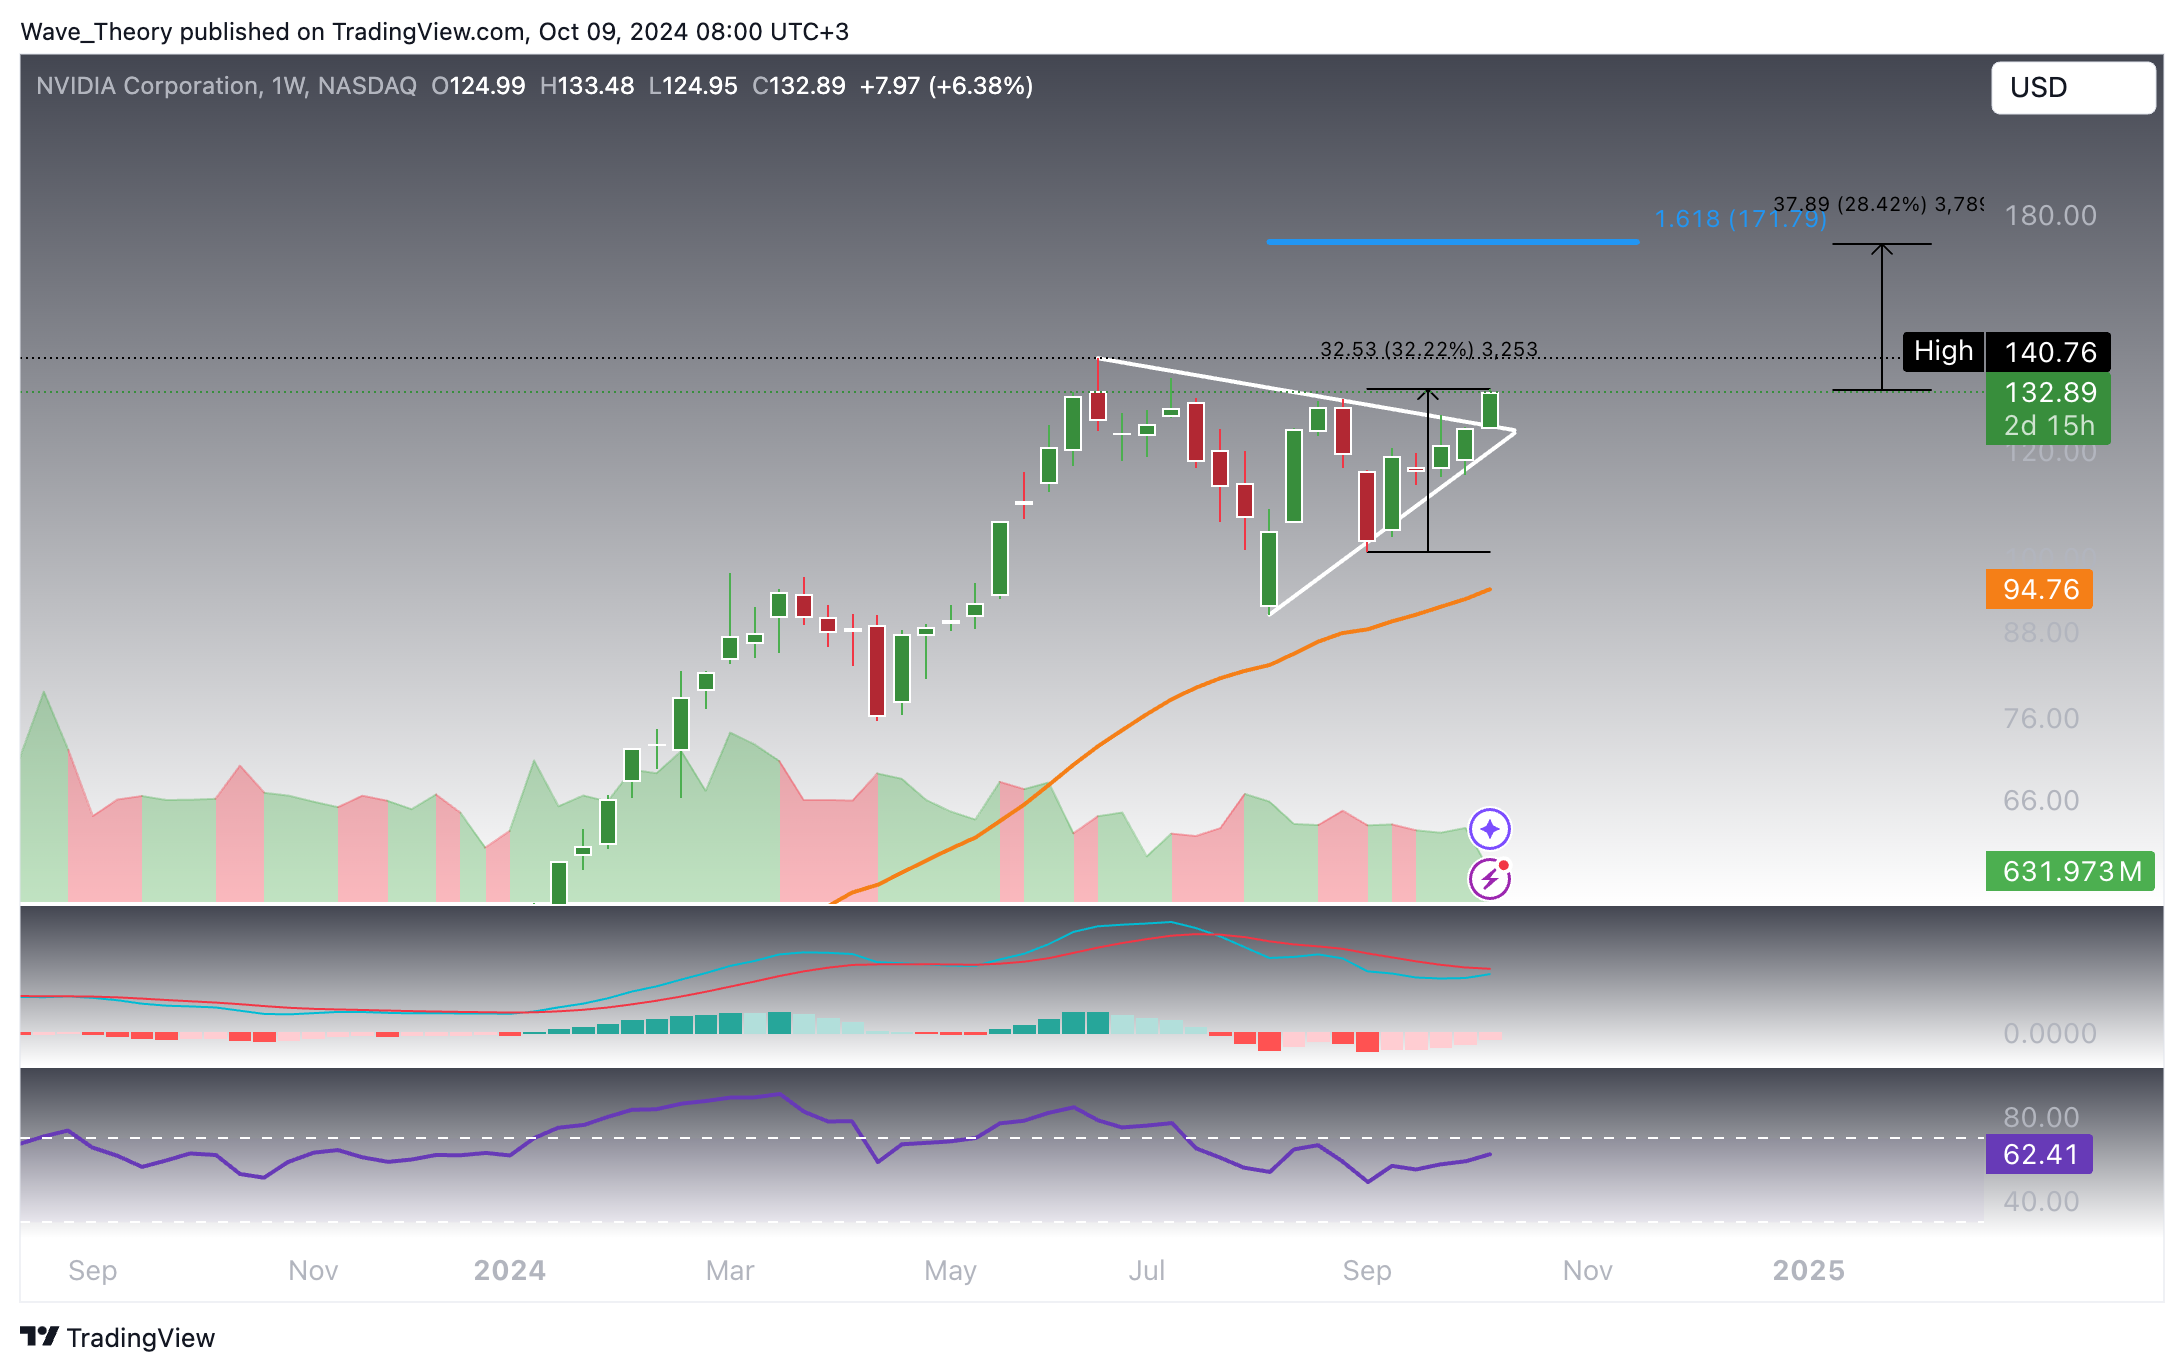
Over the past six weeks, Nvidia (NVDA) stock has surged by more than 32%. If Nvidia manages to break its all-time high (ATH) of $141, it could target the Fibonacci projection level near $172, offering an additional upside potential of approximately 28.4% from the current price.
Technical Indicators and Trends (Weekly Chart)
- MACD (Moving Average Convergence Divergence): The MACD lines are approaching a potential bullish crossover, with the histogram trending higher for the last five weeks, signaling increasing momentum.
- RSI (Relative Strength Index): The RSI remains in neutral territory, providing no immediate directional bias but leaving room for further gains.
- EMA (Exponential Moving Average): The golden crossover of the EMAs reinforces a bullish trend in the short-to-mid term, suggesting a positive outlook despite recent market fluctuations.
- Check out our free forex signals
- Follow the top economic events on FX Leaders economic calendar
- Trade better, discover more Forex Trading Strategies
- Open a FREE Trading Account
ABOUT THE AUTHOR
See More
Konstantin Kaiser
Financial Writer and Market Analyst
Konstantin Kaiser comes from a data science background and has significant experience in quantitative trading. His interest in technology took a notable turn in 2013 when he discovered Bitcoin and was instantly intrigued by the potential of this disruptive technology.
Related Articles


Comments
Subscribe
Login
Please login to comment
0 Comments
Oldest
Sidebar rates
Related Posts
