Nasdaq Bullish Outlook: Key Fibonacci Levels, MACD Signals, and EMA Trends to Watch

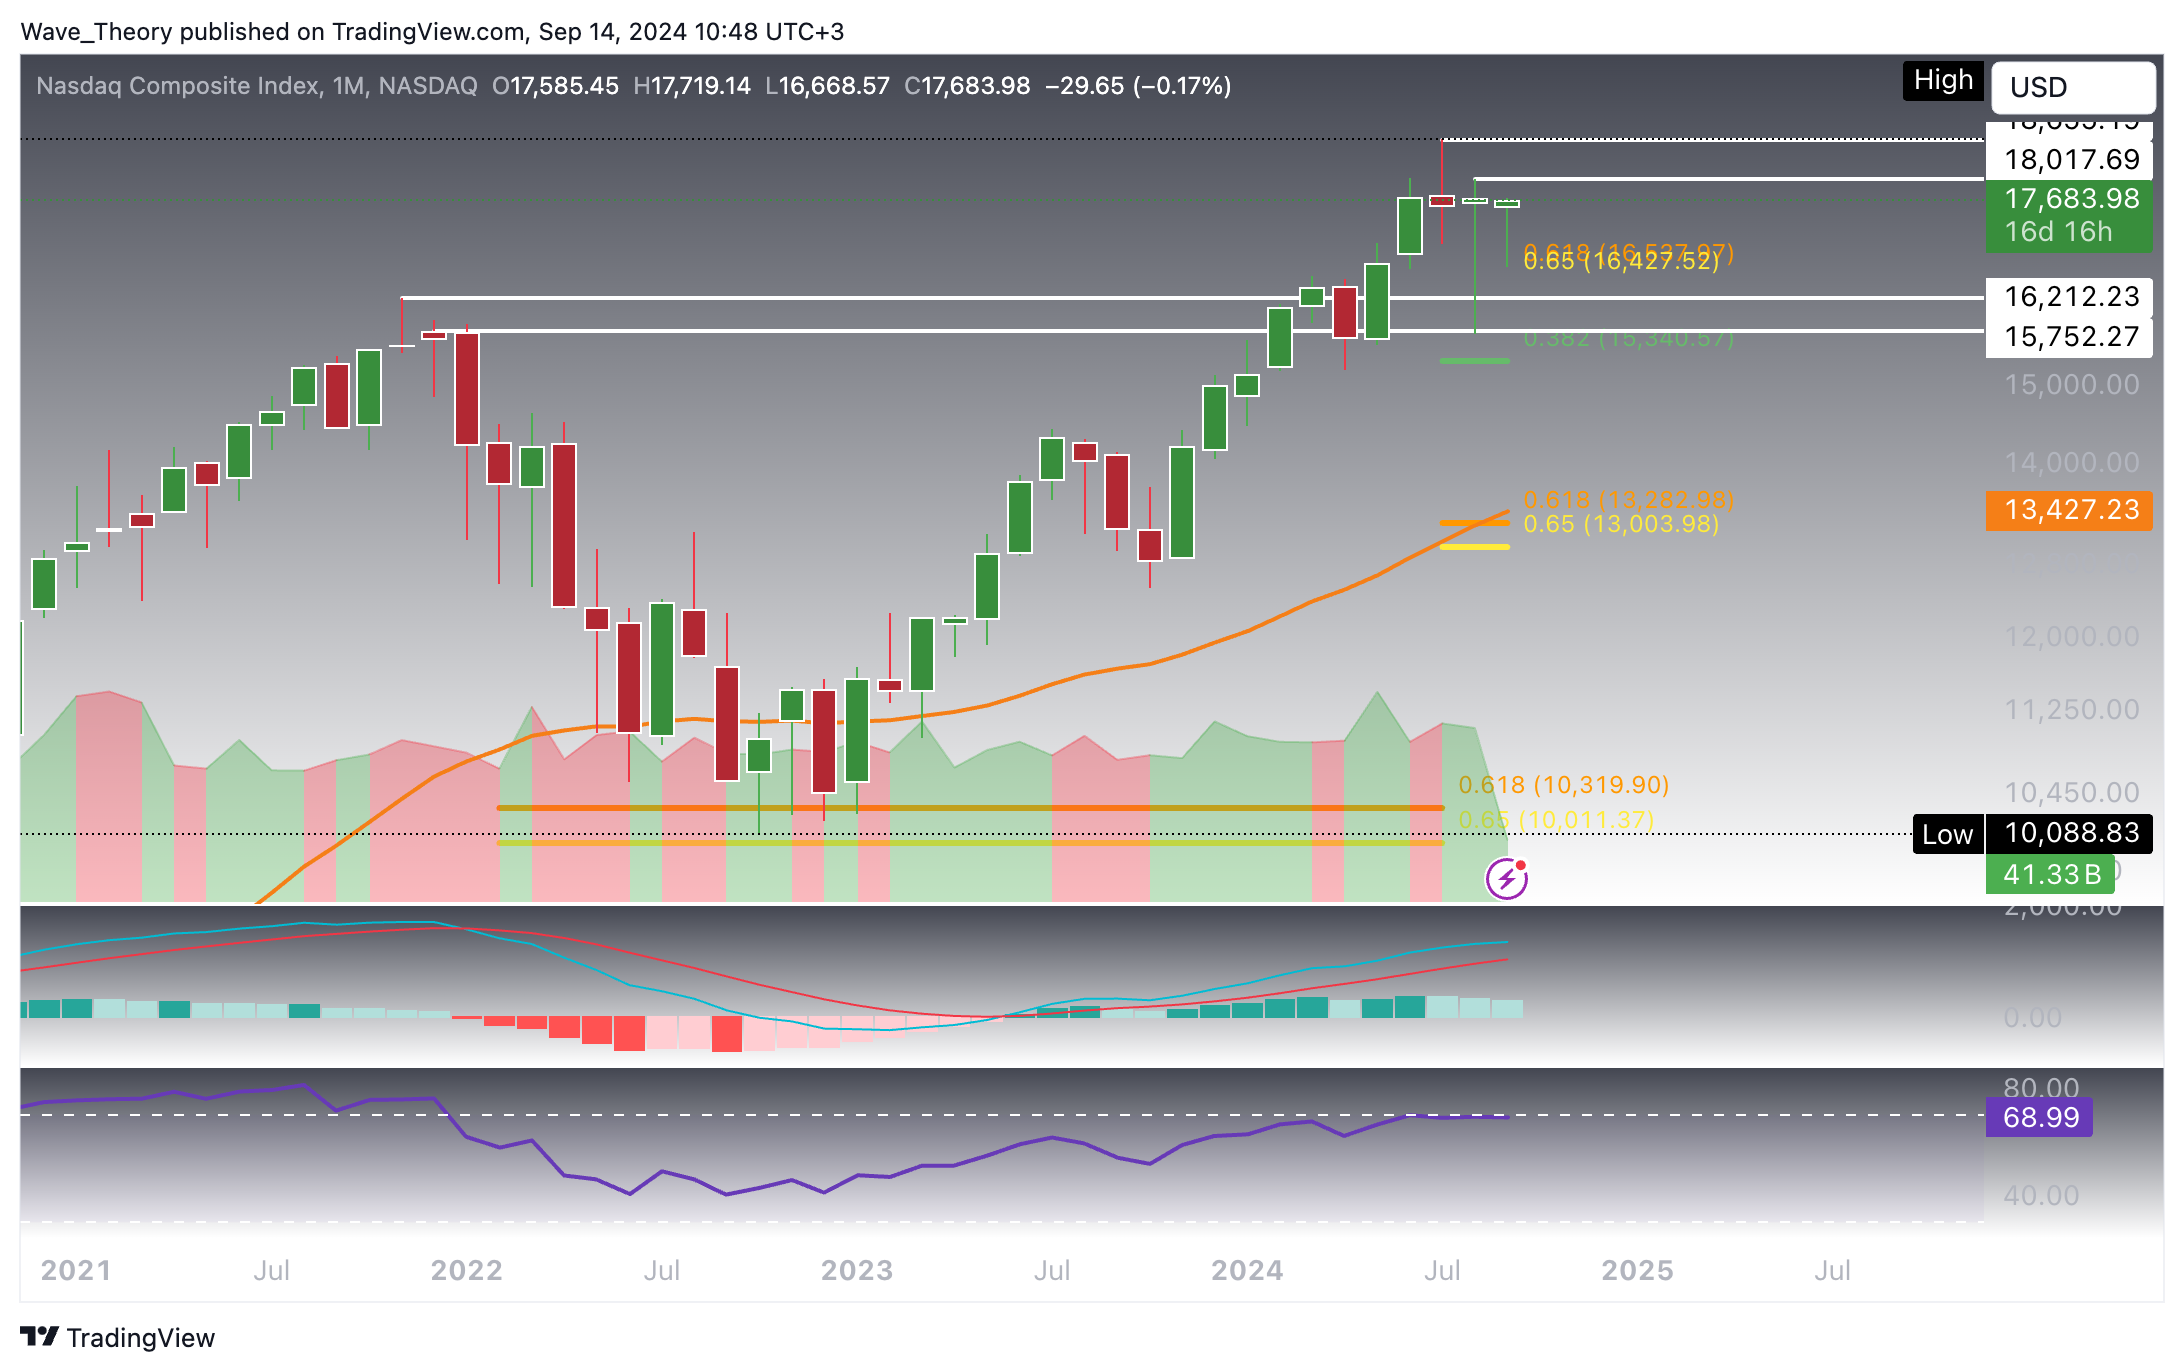
The Nasdaq Composite (IXIC) avoided reaching the 0.382 Fibonacci retracement support at 15,341, instead bouncing strongly off the support zone between 15,753 and 16,212. This has propelled the index upward, positioning its next significant resistance levels at 18,018 and 18,655.
Should the market reverse course and breach key support levels, the Nasdaq will likely find substantial support around the golden ratio, between 13,000 and 13,430, where the 50-month EMA adds further reinforcement.
Technical Indicators and Trends (Monthly Chart):
- MACD (Moving Average Convergence Divergence): The MACD lines remain bullishly crossed; however, the MACD histogram has been trending downward bearishly for the last three months, suggesting potential weakness.
- RSI (Relative Strength Index): The RSI is hovering near overbought territory but has yet to show any signs of a bearish divergence.
- EMA (Exponential Moving Average): The EMAs continue to be bullishly aligned, affirming a long-term upward trend.
This mixed technical landscape calls for caution. While the long-term trend remains intact, the bearish signals in the MACD histogram and the near-overbought RSI indicate that traders should monitor the short to medium term for potential upside but remain vigilant for signs of a reversal.
Nasdaq Recovers Nearly 15% – Is More Upside on the Horizon?
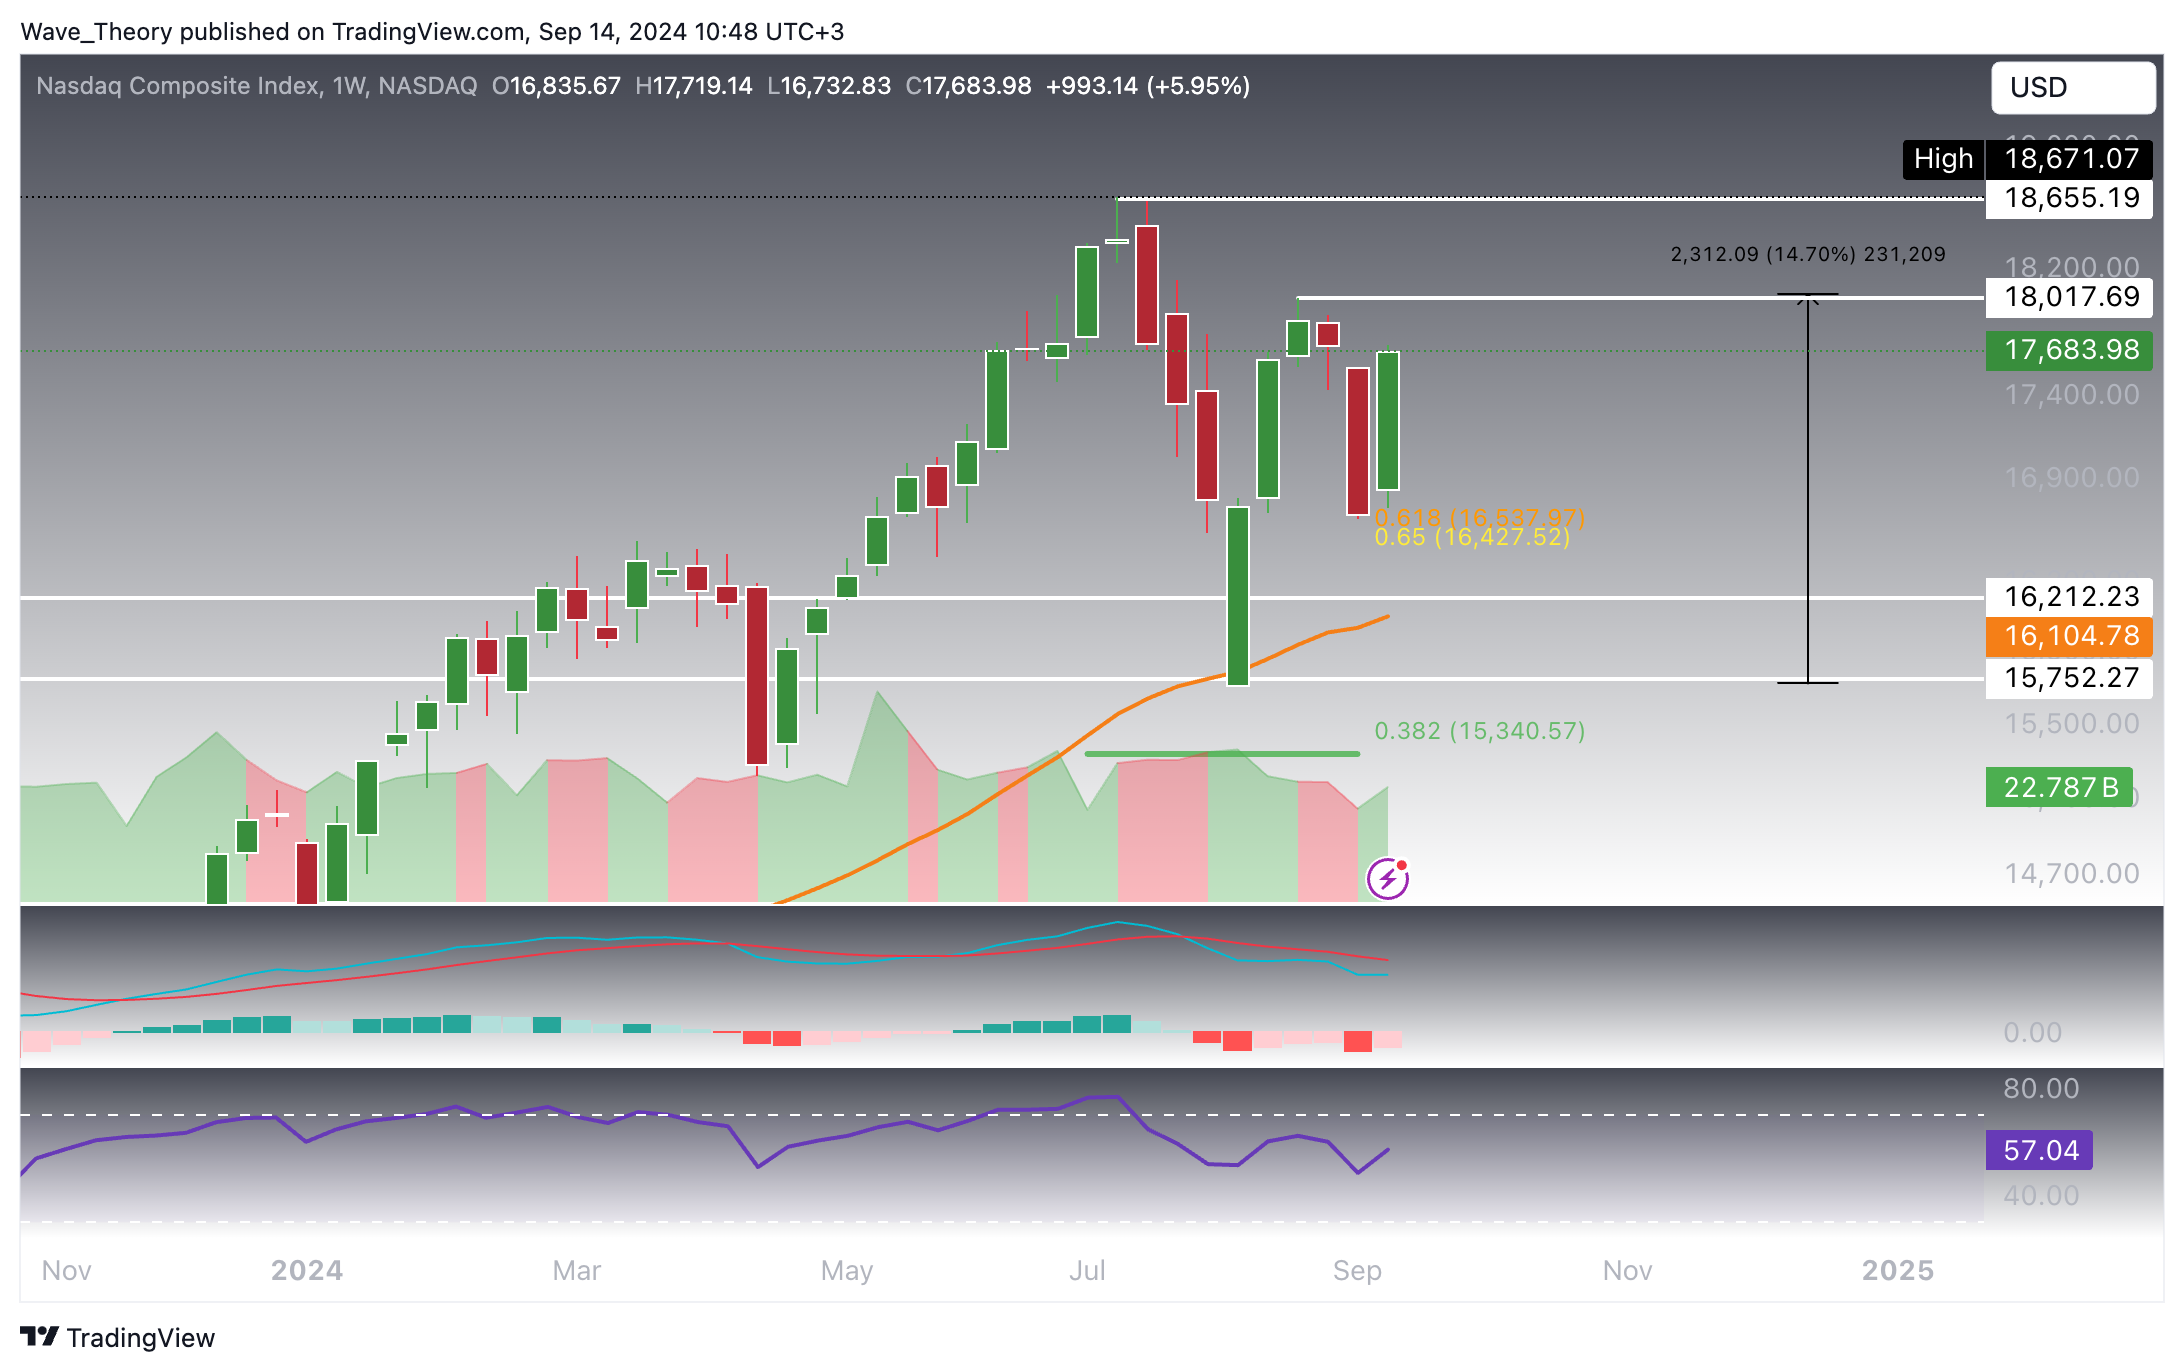
Nasdaq Faces Critical Fibonacci Resistance: What’s Next for the Index?
The Nasdaq Composite (IXIC) is now approaching a key resistance at the golden ratio level of 17,621. A bullish breakout above this level could propel the index toward its recent high at 18,018. If that level is decisively broken, Nasdaq may continue its upward trajectory, with the next significant resistance at 18,655.
Technical Indicators and Trends (Daily Chart):
- MACD (Moving Average Convergence Divergence): The MACD lines are on the verge of crossing bullishly, with the histogram having ticked bullishly higher for the past four days, indicating strengthening momentum.
- RSI (Relative Strength Index): The RSI remains in neutral territory, not signaling any clear overbought or oversold conditions.
- EMA (Exponential Moving Average): The recent golden crossover of the EMAs supports a bullish outlook in the short- to medium-term.
This technical picture reflects a generally constructive trend, though Nasdaq may encounter short-term resistance before continuing its upward movement. The reaction at key support levels will be crucial in determining the sustainability of any further bullish momentum.
 NASDAQ
4H Chart Shows Strong Bullish Signals for Nasdaq
The Nasdaq Composite (IXIC) could now find support at the golden ratio level of 17,621, which may allow it to continue its upward trajectory toward the next resistance level at 18,018. However, if the index fails to hold this level and breaks below it, a bearish move could bring it back to the golden ratio support at 16,430.
Technical Indicators and Trends (4H Chart):
- MACD (Moving Average Convergence Divergence): The MACD lines are currently crossed bullishly, and the histogram is trending upward, indicating strong bullish momentum.
- RSI (Relative Strength Index): The RSI is approaching overbought levels, but it has not yet provided a clear reversal signal.
- EMA (Exponential Moving Average): The golden crossover of the EMAs confirms a bullish trend in the short-term, reinforcing the likelihood of continued upward movement.
The 4-hour chart presents a strong bullish outlook, suggesting more potential upside in the near term, although the overbought RSI could warrant caution as the market approaches key resistance levels.
 NASDAQ
- Check out our free forex signals
- Follow the top economic events on FX Leaders economic calendar
- Trade better, discover more Forex Trading Strategies
- Open a FREE Trading Account
Related Articles


Comments
Sidebar rates
Related Posts
