


Forex Signals Brief September 3: Swiss Data and ISM Manufacturing
Yesterday was pretty quiet, with US markets being off for the bank holiday weekend at the end of summer. The price action in most markets was mixed, with the USD advancing last week’s gains against the safe havens such as the JPY, the CHF and Gold, with USD/JPY gaining more than 1 cent and climbing above 147 for a moment.
Risk assets had a better day, with the Euro and the GP making some slight gains against the USD, however, commodity dollars continued the slide, apart from the AUD which jumped higher for no particular reason. The US stock markets were closed, while European stock indices opened the day lower, however they reversed by midday and ended up with minimal gains.
Today’s Market Expectations
Today we have some important economic releases from Switzerland, such as the CPI inflation for August and the Q2 GDP report. Switzerland’s Consumer Price Index (CPI) for the year-over-year (Y/Y) measure is predicted to come in at 1.2%, a slight decrease from the previous 1.3%. Meanwhile, the month-over-month (M/M) measure is expected to rise to 0.1%, up from a previous -0.2%. Market expectations suggest that the Swiss National Bank (SNB) could deliver a total of 52 basis points of easing by the end of the year. There’s currently a 67% chance of a 25 basis point cut at the SNB’s September meeting, with the potential for the remainder to add up to a 50 basis point reduction. Recent comments from SNB’s Jordan indicate displeasure with the sharp appreciation of the Swiss Franc, raising the likelihood of a 50 basis point cut or some form of intervention to temper the currency’s strength. Additionally, today’s release of the Q2 GDP report will also be closely watched for further insights into the economic outlook.
The US ISM Manufacturing PMI is expected to increase to 47.8, up from the previous 46.8. Last month, the ISM report triggered significant selling in risk assets, leading to what was referred to as a “growth scare.” A key factor in this market reaction was the employment sub-index, which dropped to a new four-year low, setting the stage for further declines after the Non-Farm Payroll (NFP) data came in below expectations. Subsequent data throughout August suggested that the weaker-than-expected July figures might have been affected by Hurricane Beryl, causing markets to seek confirmation of a rebound in the latest PMI numbers. However, the S&P Global Manufacturing PMI released two weeks ago offered little optimism, hinting that manufacturing may continue to struggle, potentially signaling more volatility ahead.
Yesterday we had rough start to the week as the price action was irrational, despite the price action being mostly slow, with the USD gaining on some fronts, while losing against other assets. We opened 7 trading signals in total, ending with one winning forex signa and three losing trades, however, we will make up during the week.
Gold Sticks to $2,500
Earlier this week, gold reached a new high of $2,531 but then sharply dropped to $2,470 after a $60 decline on Thursday. This downturn was triggered by strong U.S. economic data, including a rebound in home sales that offset the previous month’s losses and a solid Services PMI reading above 55 points, indicating robust growth in the services sector. Despite these positive economic signals, dovish remarks from Federal Reserve Chairman Jerome Powell helped lift gold prices back above $2,500. Buyers managed to push the price up to $2,526, but it has since settled around the $2,500 mark. The 20-day Simple Moving Average (SMA) is currently providing support on the daily chart, which could help propel prices higher again if buying momentum resumes.
XAU/USD – Daily chart
The 50 SMA Turns Into Resistance for GBP/USD
GBP/USD was in a strong bullish trend for most of August, gaining 6 cents. However, the trend appears to be reversing, as recent market activity suggests. Last week, the USD found some support, pushing this pair 1.5 cents lower, while yesterday’s modest retracement higher faced resistance at the 50-day SMA. This could indicate a potential shift in momentum, with the USD possibly gaining strength and further limiting GBP gains in the near term. Traders will be closely watching upcoming economic data and market signals to gauge the next move in this currency pair.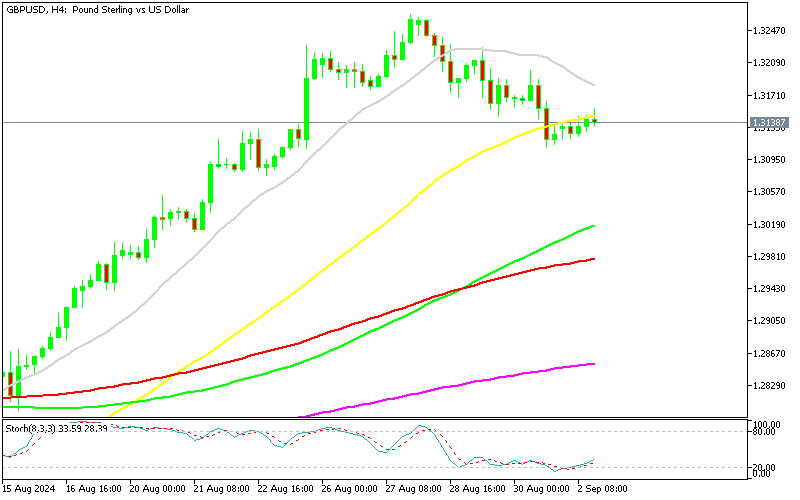
GBP/USD – H4 Chart
Cryptocurrency Update
Bitcoin Consolidates Below $60K

BTC/USD – Daily chart
Ethereum Consolidates Below $2,500
Ethereum has been in a downtrend since March, with a series of lower highs pointing to the potential for further declines in August. After a sharp drop from $3,830 to below $3,000, Ethereum briefly recovered in June, moving above the 50-day SMA. However, continued selling pressure led to another decline, pushing the price below the 200-day SMA before rallying back to around $2,600. Currently, buyers are testing the 20-day SMA, indicating a likely battle between bulls and bears for the market’s direction. This tussle around the 20-day SMA will likely be a key factor in determining whether Ethereum can stage a lasting recovery or if the downward trend will persist.
ETH/USD – Daily chart


Sidebar rates
Related Posts
Add 3440

