Ethereum (ETH) Grapples for Direction: Bulls Point to Network Activity, Bears Cite Waning Interest

Ethereum’s price has been on a volatile rollercoaster ride in recent weeks, gaining 7.5% since its August 27th low but still down 22% in the last month. While network activity is on the rise, Ether’s price struggles to reclaim its June highs above $3,800.
Compared to other altcoins, Ethereum has underperformed. The altcoin market cap’s 13% decline highlights this disparity, suggesting that investors may be shifting their focus to other opportunities.
Lackluster Spot ETF Demand
Despite the anticipation surrounding the launch of spot Ether ETFs in July, the actual inflows into these funds have been underwhelming. This lackluster demand has contributed to Ethereum’s price weakness.
Spot Ether ETF funds have witnessed net outflows of $107 million in the past two weeks, contrasting with strong inflows for Bitcoin ETFs. This suggests that institutional investors may be shifting their focus to Bitcoin or other assets.
However, a recent reversal in market inflows with BlackRock’s ETHA recording $8.4 million suggests a potential shift in investor preference from Bitcoin to Ethereum. This could be a positive sign for Ethereum’s future.
Bullish Arguments
A significant drop in average transaction fees below $1 for the first time in four years is a positive sign for Ethereum. This reduction in costs could make the network more attractive to users and developers.
Moreover, the successful adoption of layer-2 solutions like Ethereum’s Base reinforces its dominance in decentralized applications (DApps). These scalable solutions can handle more transactions and reduce congestion on the mainnet.
Bearish Arguments
Lower fees and simpler user experiences on competing chains like Tron (TRX) and BNB Chain (BNB) pose a threat to Ethereum’s dominance. These chains offer a more accessible entry point for newcomers.
Additionally, critics argue that users may prioritize self-sovereignty over direct access to services like Coinbase offered by Base. This suggests that the centralization aspect of Base could be a deterrent for some users.
Ethereum Network Activity on the Rise (Despite Caveats)
The total value locked (TVL) on Ethereum has risen, indicating increased confidence in the network. Key projects like Symbiotic have seen significant growth in their TVL.
Furthermore, DApp volumes on Ethereum have also grown, driven by platforms like Uniswap and Balancer. This suggests that users are actively engaging with decentralized applications on the Ethereum network.
However, the number of active addresses and transactions using DApps hasn’t grown proportionally. This indicates that while DApp activity is increasing, the number of unique users and the frequency of interactions may not be keeping pace.
Moreover, BNB Chain and Solana have seen an increase in active users compared to Ethereum. This suggests that these competing chains are attracting new users who may not be as familiar with Ethereum.
CBOE Files for Options on Bitcoin and Ethereum ETFs
The Chicago Board Options Exchange (Cboe) has filed applications to list options on Bitcoin and Ethereum exchange-traded funds (ETFs). This move could potentially attract more institutional investors to the Ethereum market.
However, the SEC approval process for these ETFs is uncertain, and there could be significant delays.
ETH/USD Technical Analysis
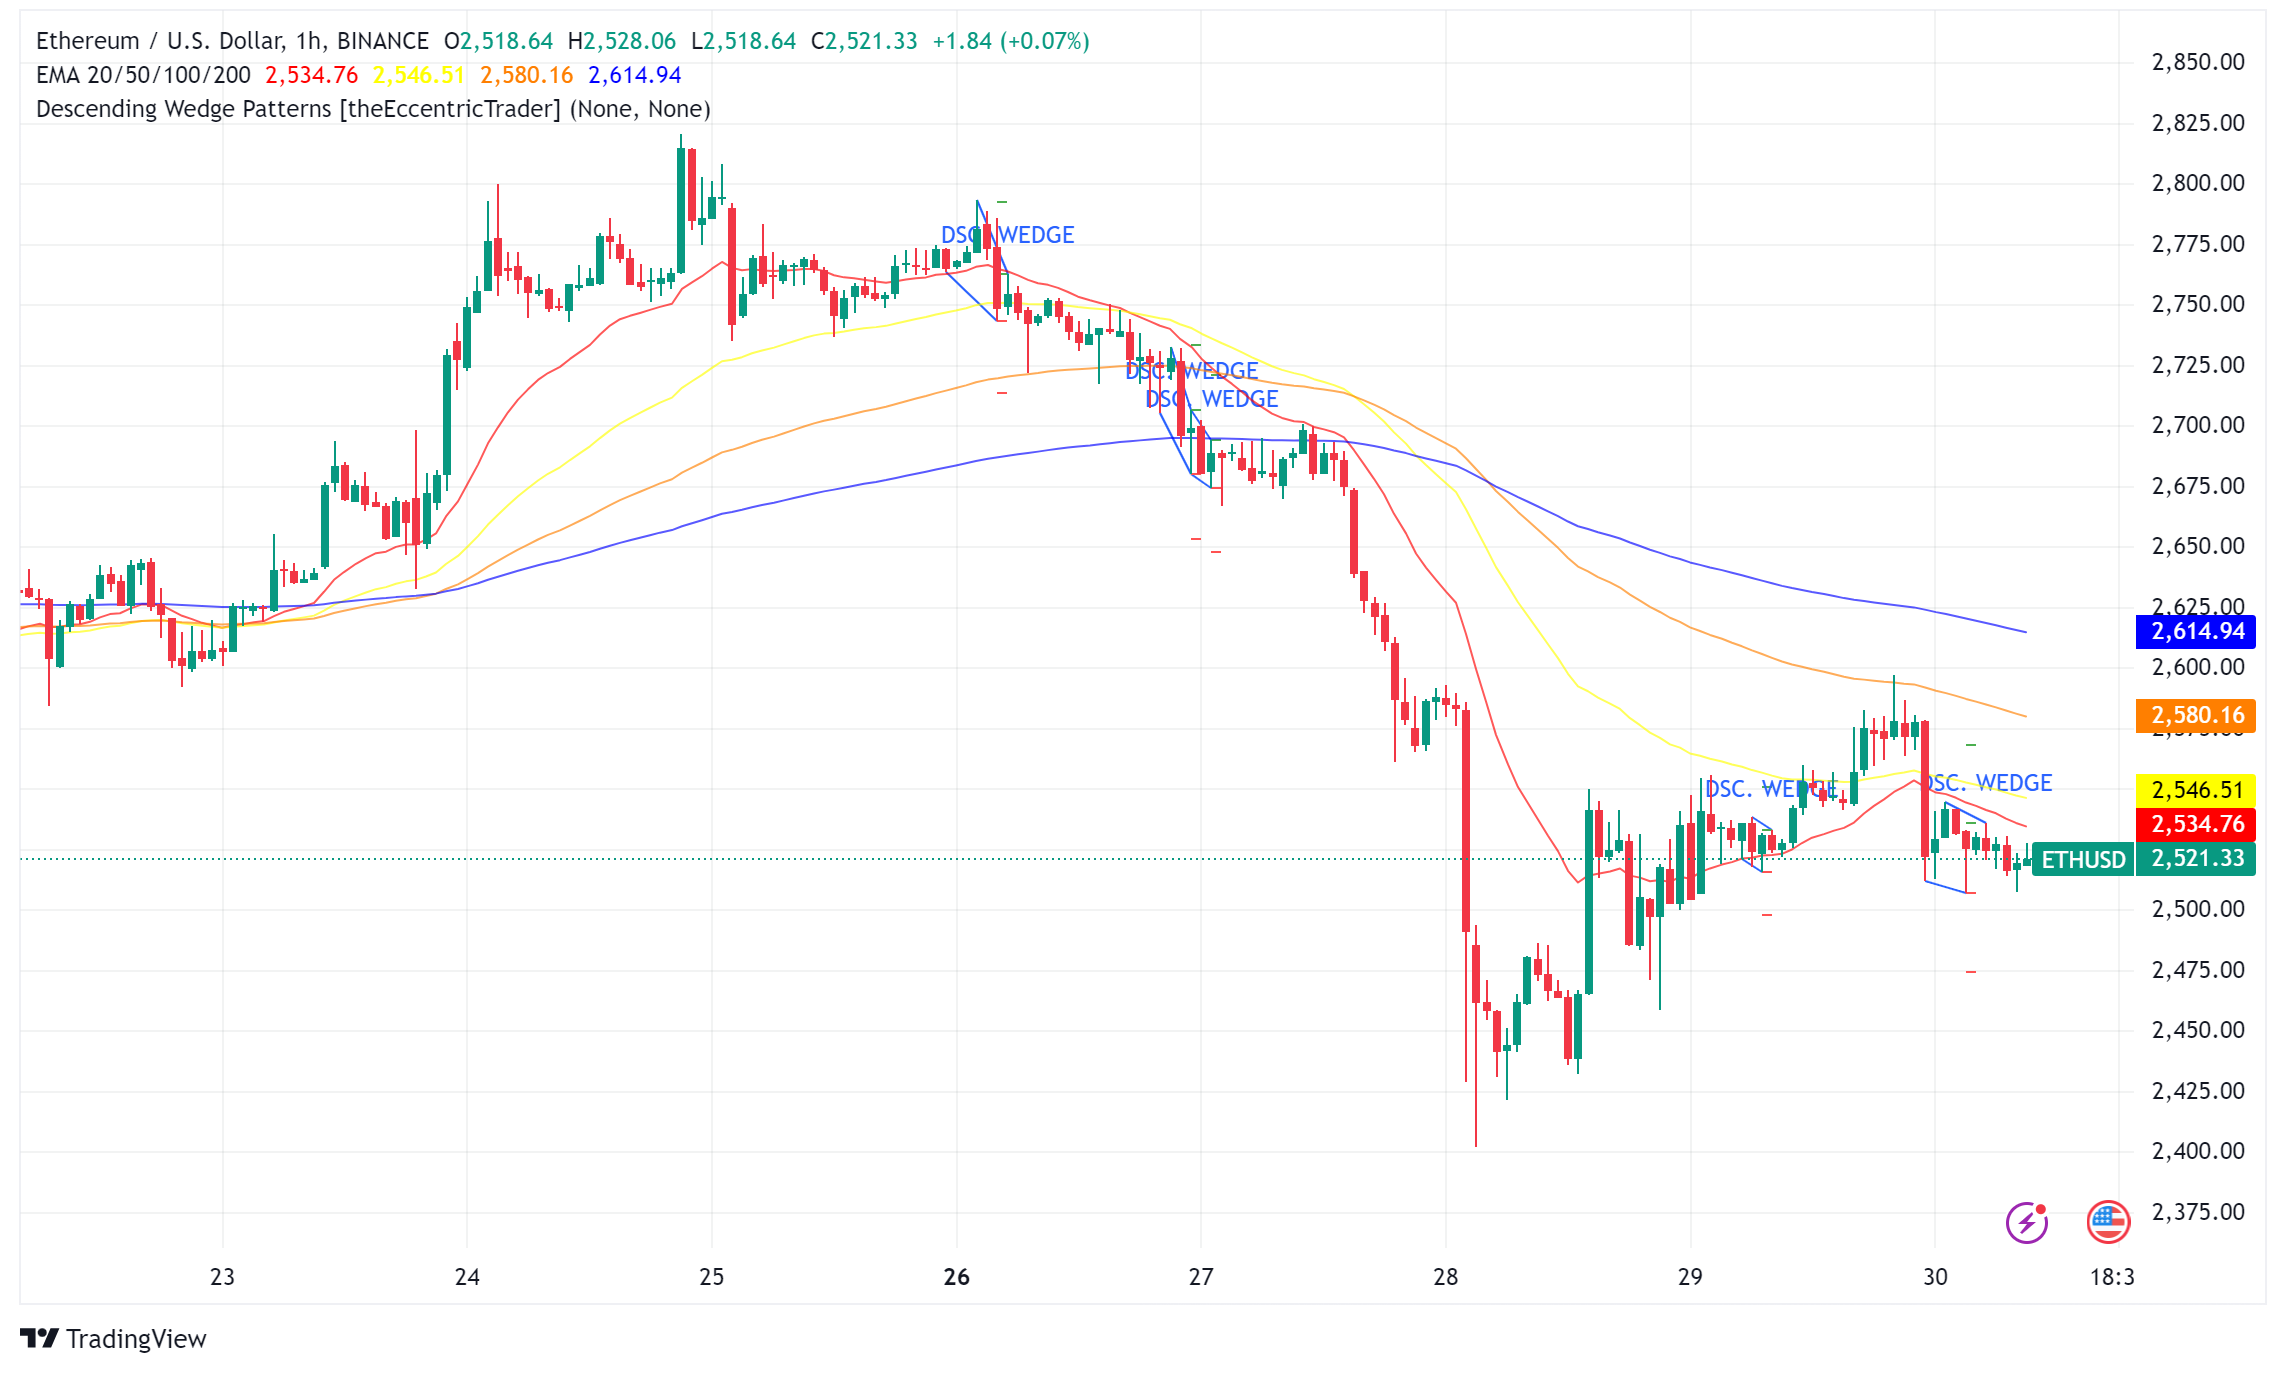
Resistance levels sit around $2,720-$2,760 and $2,800-$2,840. Support zones are present at $2,440-$2,480 and $2,360. The market is currently characterized by frequent price reversals and volatility. A potential bullish reversal could be indicated by a break above $2,600.
- Descending Wedge Pattern: Ethereum has been forming a descending wedge pattern, which is generally considered bullish. A breakout from this pattern could signal a significant price increase.
- 50-Day Exponential Moving Average (EMA): The price is currently below the 50-day EMA, indicating a bearish trend. However, a break above this level could suggest a potential reversal.
- On-Chain Indicators: The NVT ratio and whale accumulation suggest that there might be underlying bullish sentiment, despite the bearish price action.
Potential Price Scenarios
- Breakout from Descending Wedge: If Ethereum can successfully break out from the descending wedge pattern, it could target a price of around $2,800, representing a potential 10% increase from the current level.
- Retest of Support: If the price fails to break out and instead retests the $2,440 support level, it could lead to further downside pressure.
- Sideways Consolidation: Ethereum might enter a period of sideways consolidation, allowing for a potential accumulation phase before a more decisive move.


