Bitcoin Stable: Traders Are watching These 2 Very Important Support Levels
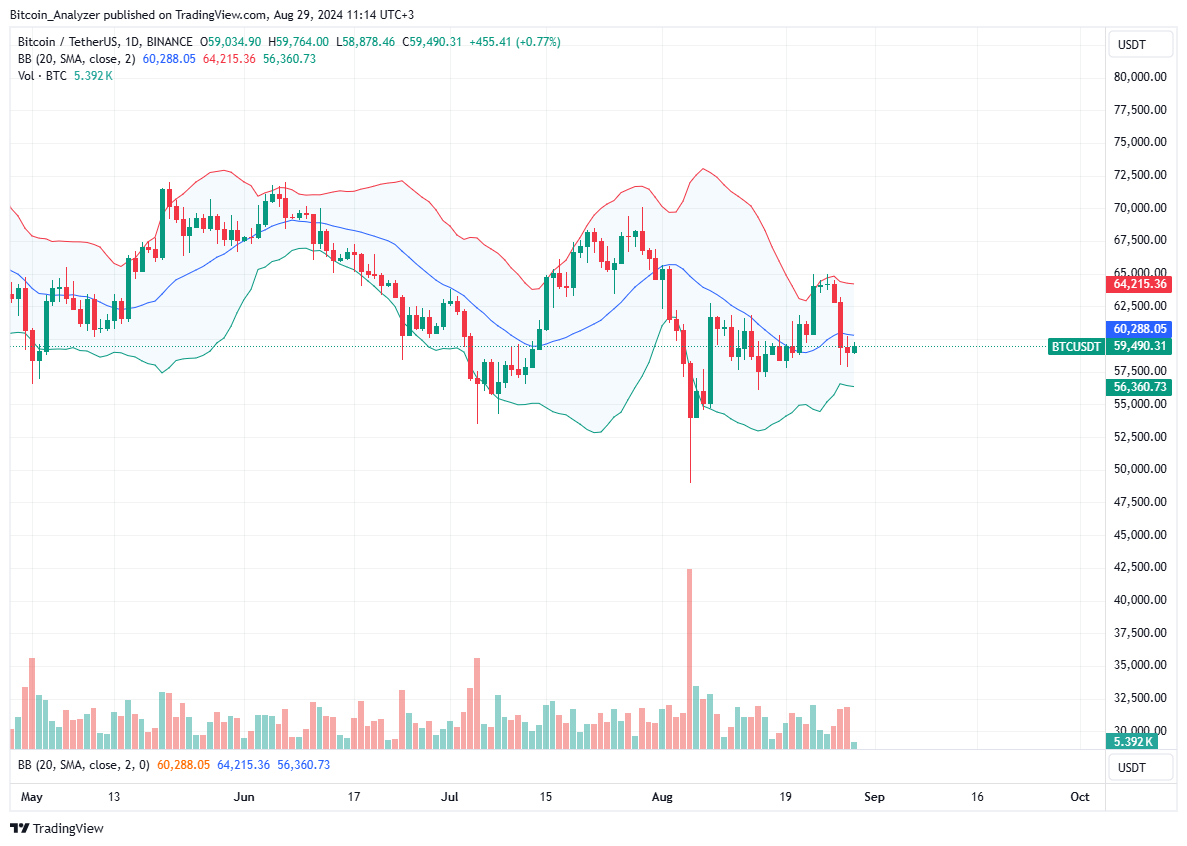
Bitcoin is stable when writing, looking at the performance in the daily chart. Even though some traders are optimistic about what lies ahead, the liquidation of the past two days remains a concern. Technically, sellers are now in the equation, as long as the primary resistance is at $66,000. For the trend to shift, prices must roar above August highs, ideally with rising trading volume. Before then, as long as the August 27 losses are not peeled back, sellers will be in control in the short term.
Considering the formation in the daily chart, it is clear to see why the coin is in red. To put in the numbers, Bitcoin is stable on the last day but down 3% in the previous week. Since the sentiment is rapidly shifting to bearish and more traders have been liquidated, there is a notable expansion in trading volume, exceeding $35 billion in the last 24 hours.
Traders are closely watching the following trending Bitcoin news:
- Bitcoin is bearish, per the daily chart. However, one analyst notes that more traders are shifting from bullish to bearish on Binance, the world’s largest crypto exchange.
- According to one analyst, as Bitcoin plunges, the immediate level to watch out for is $55,000. This support level coincides with June and May lows but is the average price at which Binance traders bought. A level deeper, miners will be in green as long as prices trend above $44,000.
Bitcoin Price Analysis
BTC/USD is stable at press time.
There is no relief for holders, looking at the daily chart.
Unless otherwise there is a spike above $63,000 but most importantly $66,000, sellers will be in control.
Accordingly, aggressive traders can align with the dip of August 27, targeting $56,500 and $50,000 in the short-term.
Notice that the bear bar of Tuesday is wide-ranging and has high trading volume.
Additionally, it is a bear breakout bar, reversing all losses of August 23.
Sidebar rates
Related Posts
