Ethereum Gas Fees Plummet, Supply Shock on Horizon: Bullish Signs for ETH?

Ethereum (ETH) is experiencing a significant drop in transaction fees, potentially paving the way for wider adoption and a bullish market sentiment.
Ethereum Transaction Fees Hit Rock Bottom
Data from Glassnode reveals the average gas price for sending ETH transactions has fallen to a record low of 2.6 Gwei, translating to fees as low as $0.28 for standard speed transfers. This marks a dramatic decrease compared to a year ago, when gas prices hovered around 16 Gwei, significantly inflating transaction costs.
Several factors contribute to the decline in gas fees. Recent network upgrades have streamlined transaction processing, enabling the network to handle more transactions at a lower cost. Additionally, a decrease in overall transaction volume on Ethereum’s Layer 1 has reduced congestion and fees.
Supply-Side Squeeze Hints at Bullish Market
Adding to the bullish outlook, a recent trend shows a significant decrease in the amount of ETH held on centralized exchanges. Currently, only 9.8% of the total ETH supply resides on these platforms, a record low and a potential indicator of a supply-side shock. This often translates to a price surge as fewer coins are readily available for sale. Leon Waidmann, Head of Research at the Onchain Foundation, believes this trend could positively affect the future price of ETH.
ETH Whale Activity: Mixed Signals
While the overall outlook appears promising, a recent sale by a prominent Ethereum whale has caused some concern. The whale sold 8,825 ETH, worth roughly $25 million, at a loss, potentially reflecting a short-term market correction. However, this isolated incident needs to be viewed in the context of ongoing whale accumulation throughout the year, fueled by initial price surges.
What’s Next for ETH Price?
Experts are cautiously optimistic about the future of ETH. On-chain data suggests a potential rally if the price breaks above the $3,000 resistance level. Additionally, data from CryptoQuant shows significant accumulation by whales in the past few days, suggesting continued interest in the asset.
ETH/USD Technical Analysis Paints a Mixed Picture
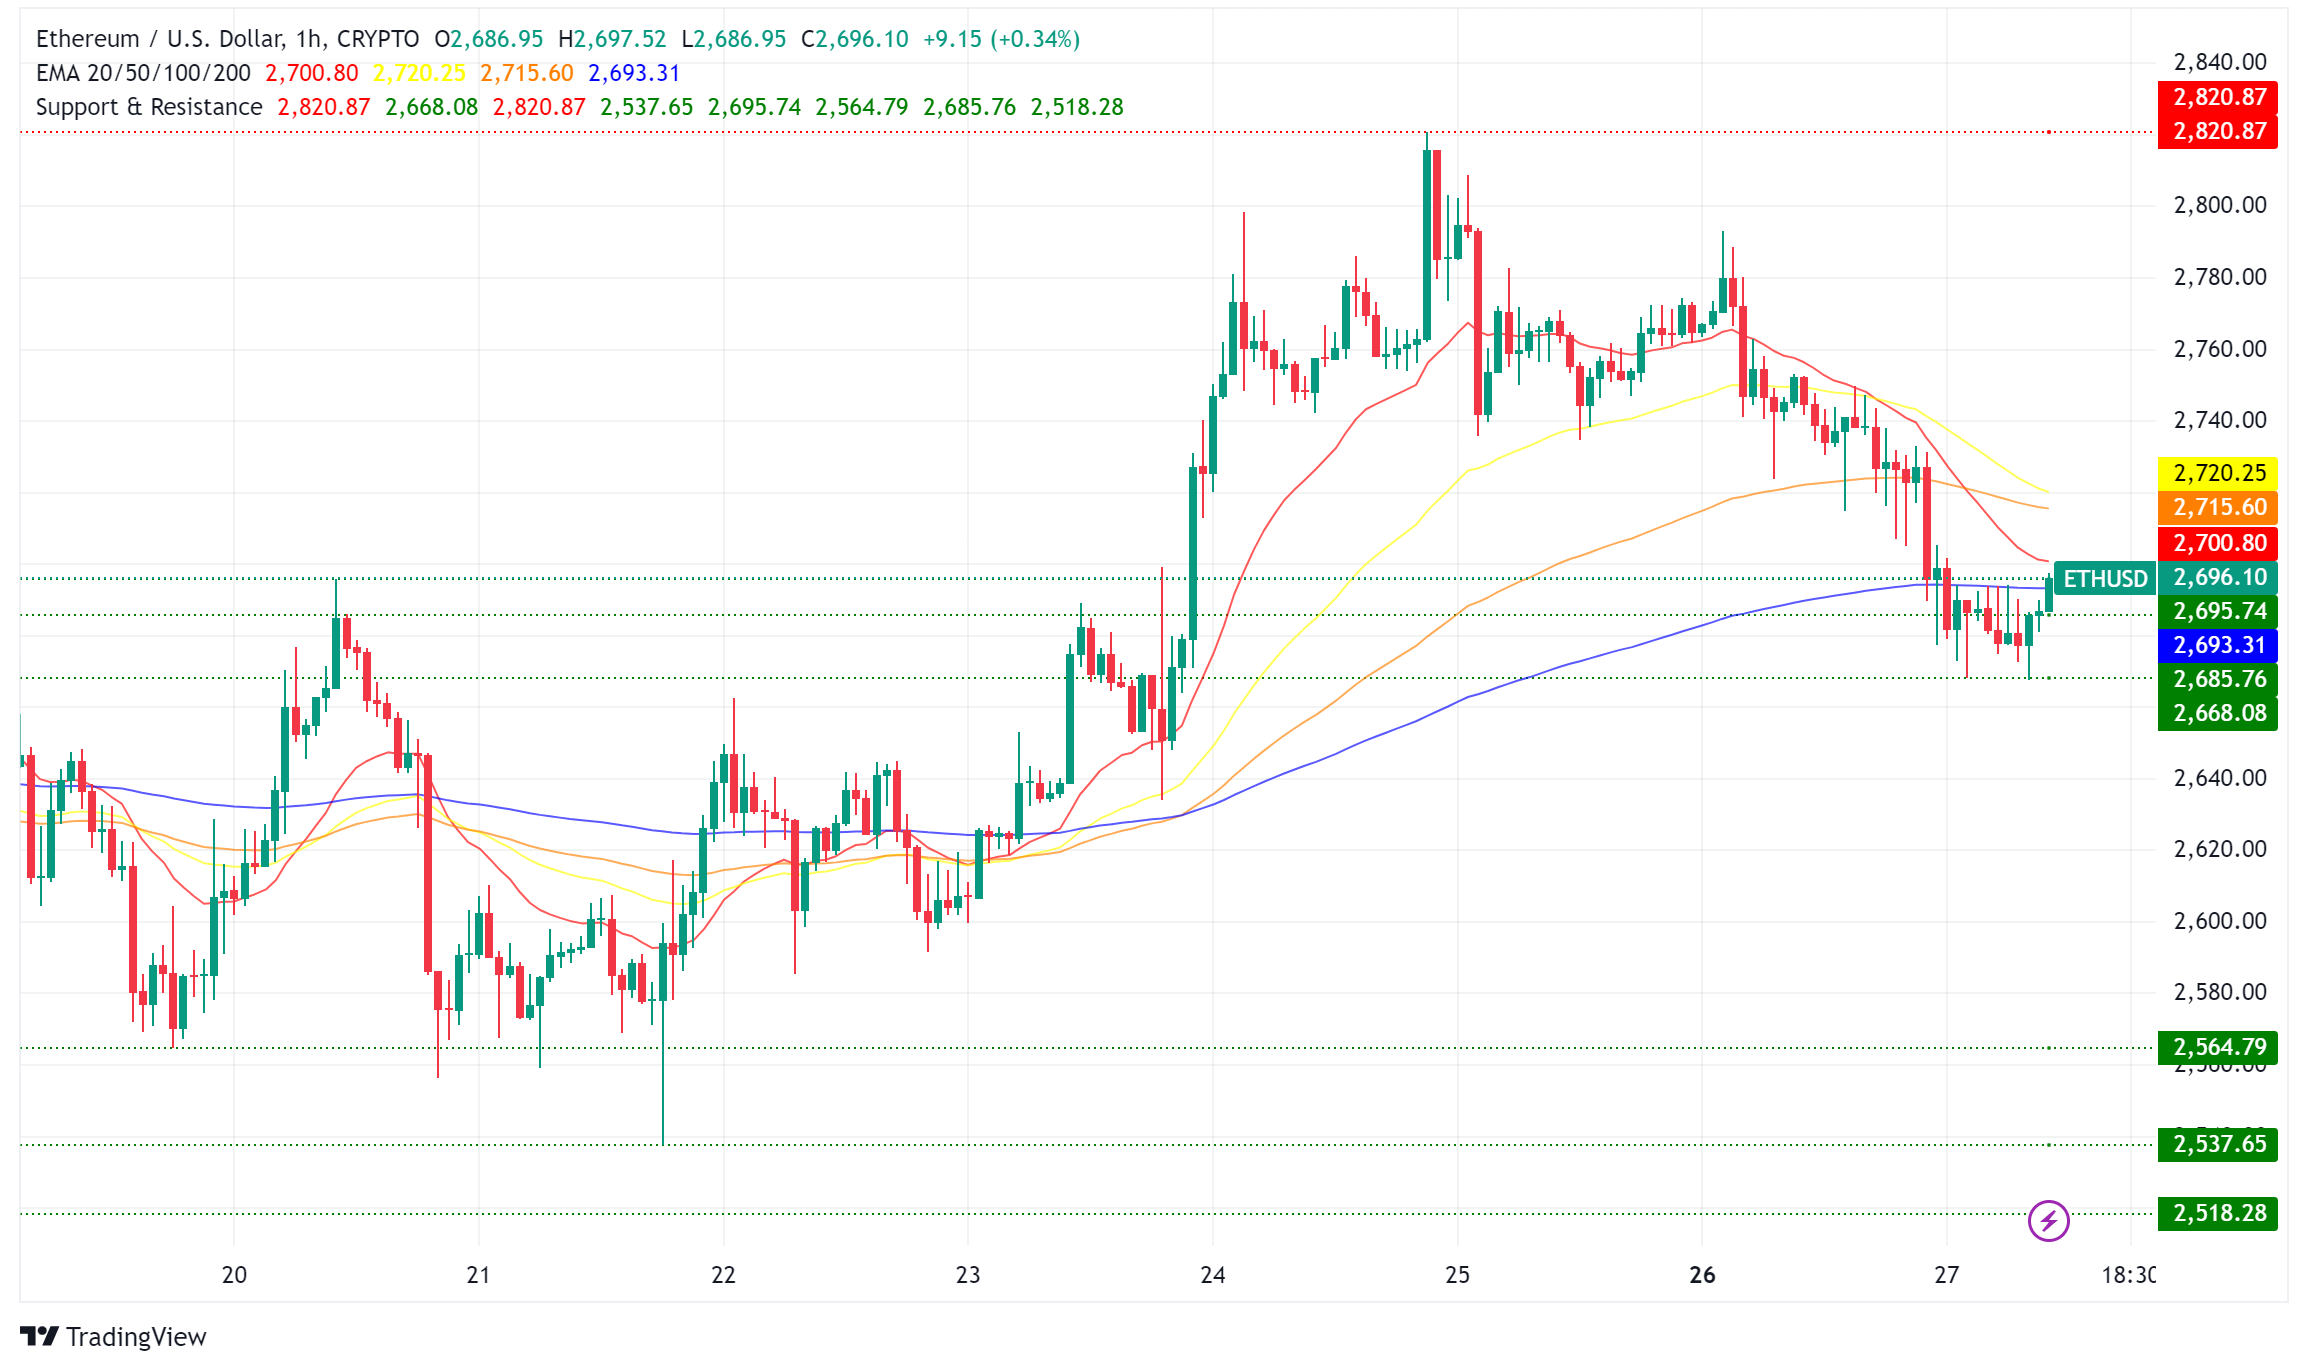
While the long-term outlook appears positive, a technical analysis of the ETH price chart reveals a potential for further downside correction in the short term. The price is currently trading below key resistance levels, with potential support zones at $2,645 and $2,600. However, a break above $2,740 could trigger a rally towards $2,880 and even $3,000.


