Bitcoin Stalls After Early August Surge, Analysts Debate Next Move
Bitcoin price action remains choppy despite positive developments. The world's leading cryptocurrency reached a high of $65,000 twice in
Bitcoin price action remains choppy despite positive developments. The world’s leading cryptocurrency reached a high of $65,000 twice in recent days but failed to break decisively above key resistance levels. Analysts are now divided on whether a correction or a breakout is more likely.
Short-Term Correction Possible
Several factors suggest a potential price dip in the near future.
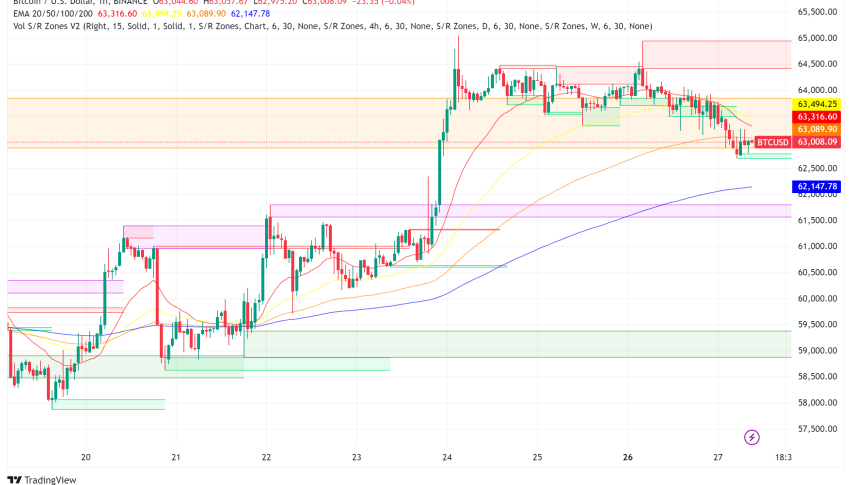
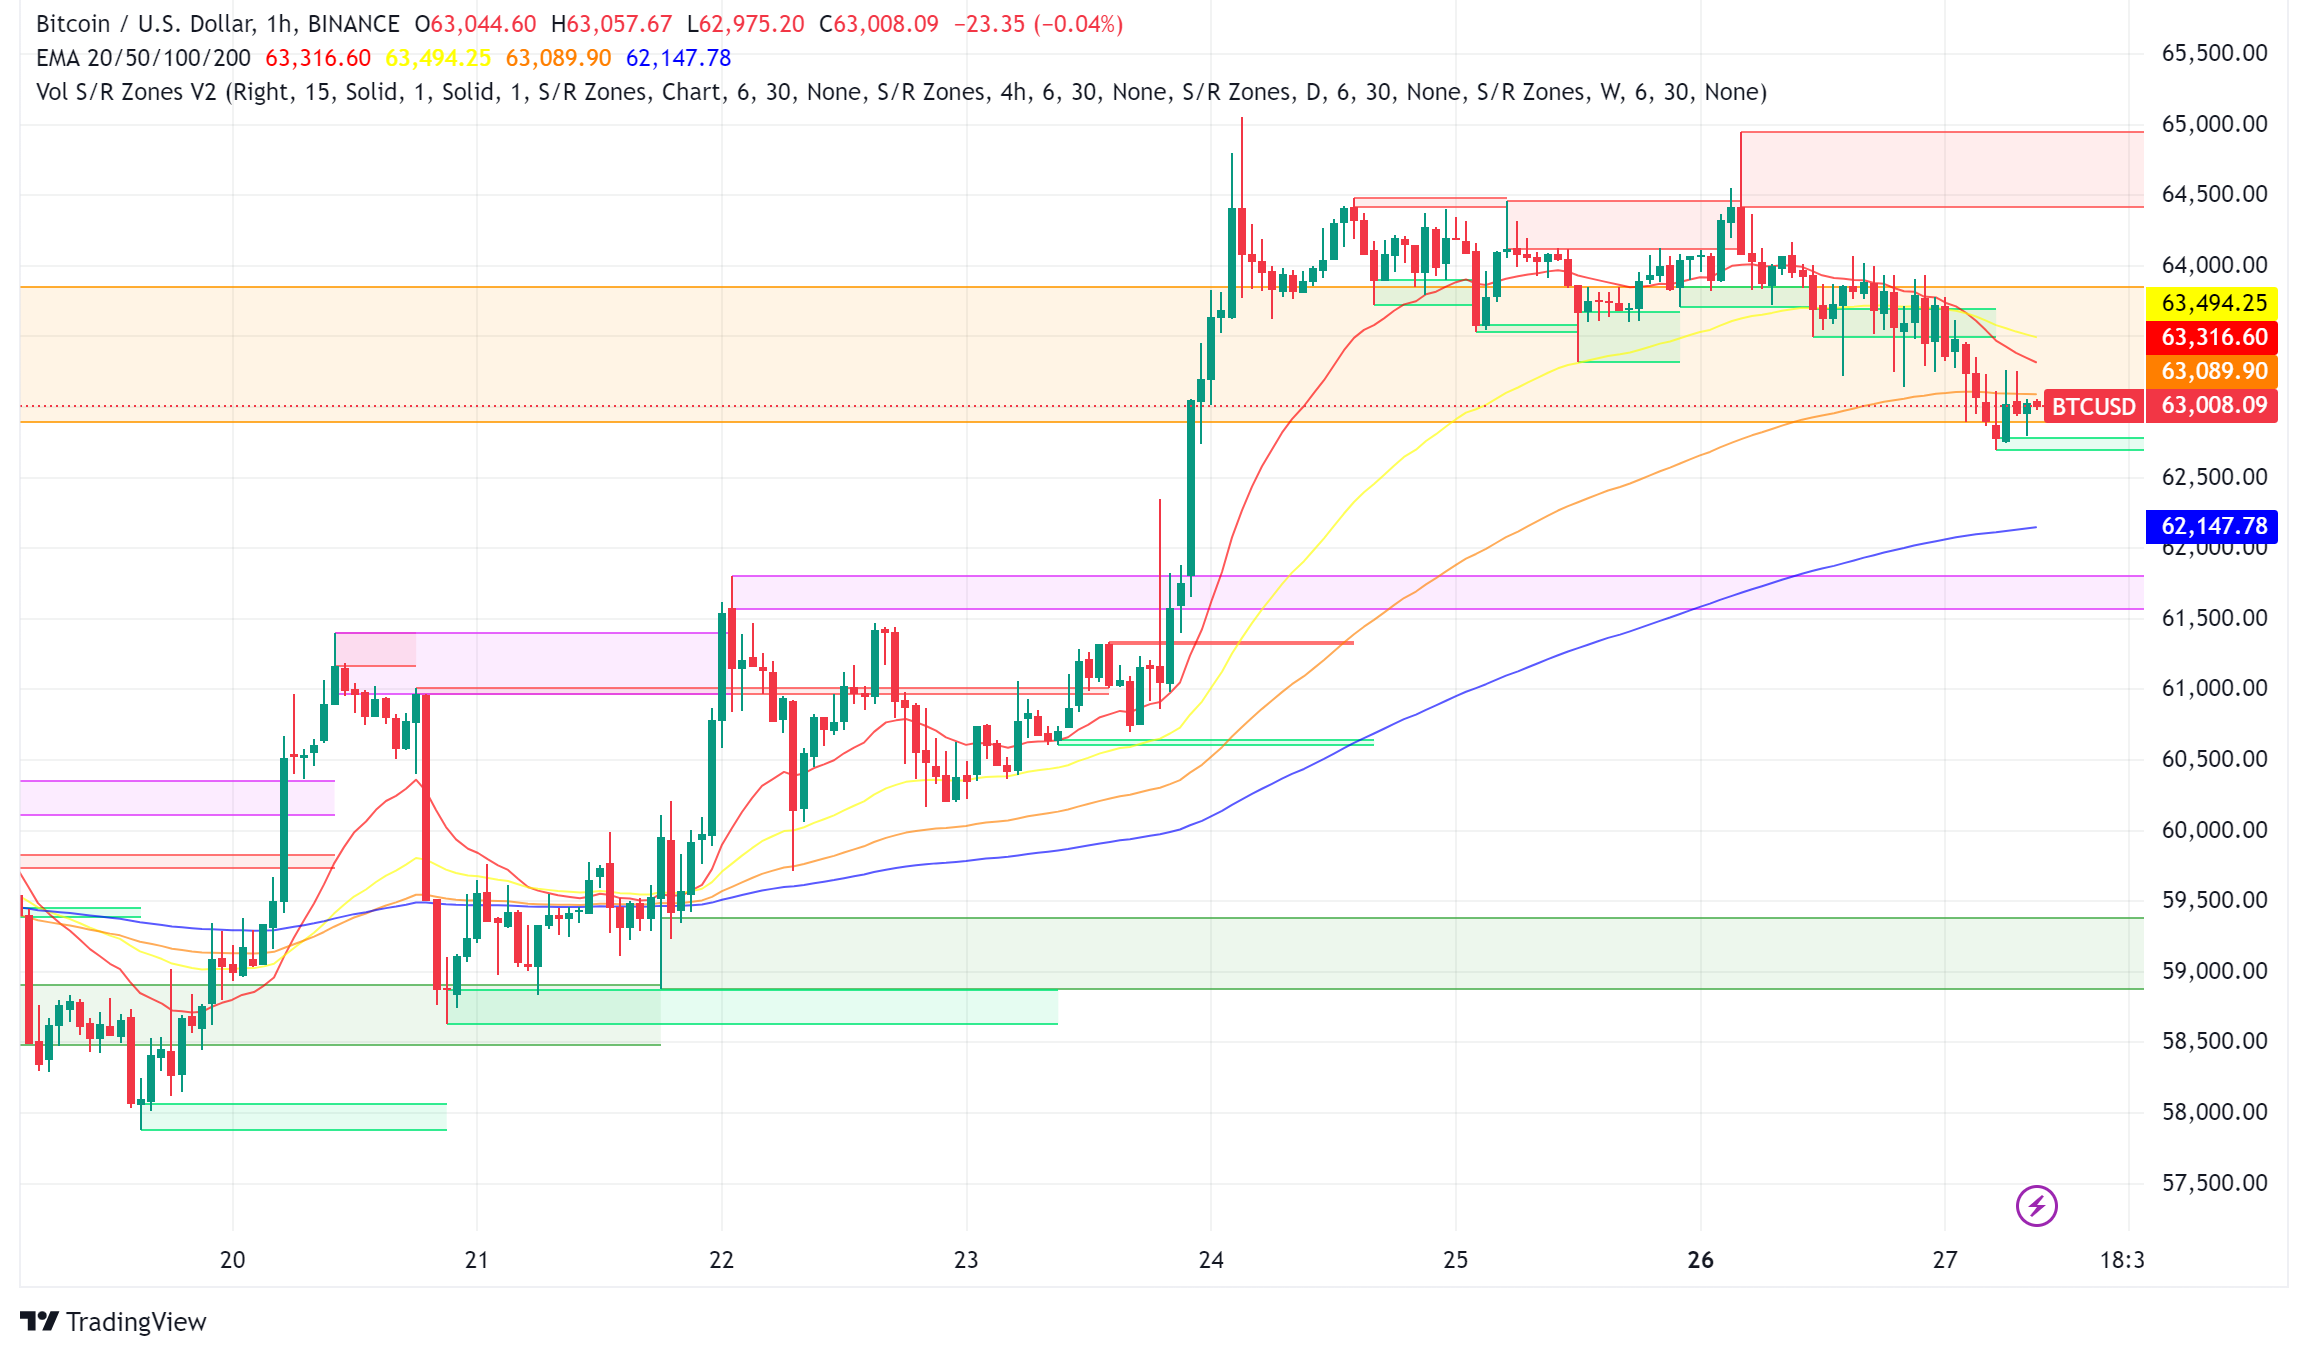
- Order book liquidity: Trading data indicates shifting order book dynamics on Binance, favoring bears. This suggests a potential decline towards $62,500.
- Lack of follow-through: Popular traders like Crypto Chase point out the absence of aggressive buying pressure typically seen during a true breakout.
- Bart pattern concerns: Some analysts fear a “Bart Simpson” maneuver, where the price temporarily dips before returning to its previous position.
Bullish Signs Remain
Despite the correction warnings, there are reasons for optimism:
- Strong monthly close: Bulls are aiming to close August with a “green” monthly candle, erasing most of the recent losses.
- Institutional Interest: U.S.-listed spot Bitcoin ETFs saw significant inflows on positive market sentiment. BlackRock’s IBIT and Fidelity’s FBTC led the pack.
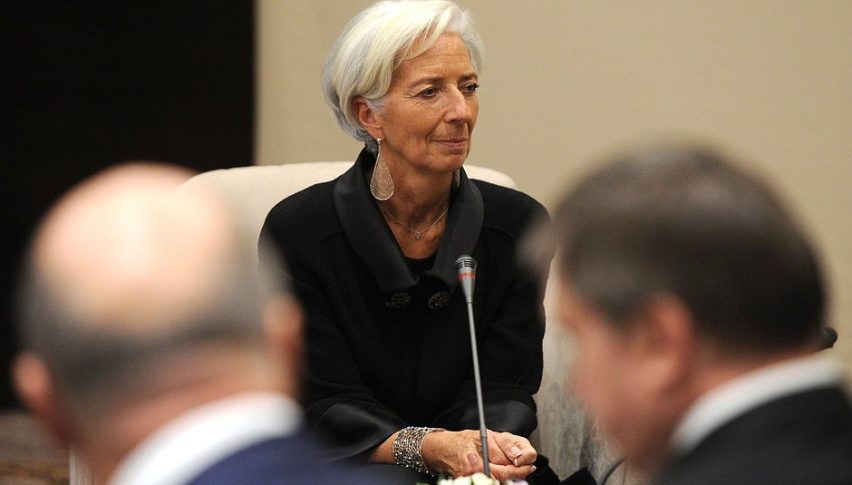
Fed Policy a Key Driver
The Federal Reserve’s monetary policy decisions will significantly impact Bitcoin’s price trajectory.
- Potential Rate Cut: Market expectations of a rate cut in September could trigger a rally above $68,000 according to some analysts.
- Loose Monetary Policy: Federal Reserve Chair Jerome Powell’s dovish speech at Jackson Hole fueled speculation of a policy shift towards easier money, historically positive for Bitcoin.
Bitcoin ETF Inflows on the Rise
U.S.-listed spot Bitcoin ETFs experienced their highest daily net inflows since July, exceeding $252 million. This suggests increased institutional interest and potential buying pressure.
BTC/USD Technical Analysis Offers Mixed Signals
Some analysts, like Mikybull, see a potential surge to $95,000 based on technical indicators on the weekly chart. Others, like Material Indicators, highlight the presence of significant resistance at $65,000 and potential long liquidations if the price falls below $63,000.
Conclusion
The short-term outlook for Bitcoin remains uncertain. While some analysts predict a correction, others see a potential breakout fueled by positive economic data and expectations of a dovish Fed. Investors should closely monitor key technical levels and economic developments as Bitcoin navigates this critical juncture.
- Check out our free forex signals
- Follow the top economic events on FX Leaders economic calendar
- Trade better, discover more Forex Trading Strategies
- Open a FREE Trading Account
Related Articles
Comments
Sidebar rates
Related Posts
