Will Bitcoin Overcome Obstacles Before Heading for $70,000?
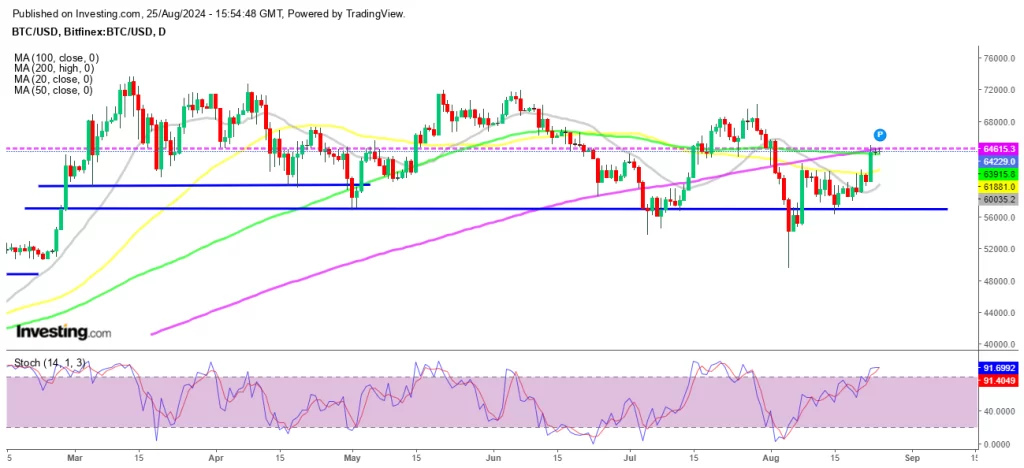
After the crash in early August, Bitcoin is back up, with buyers pushing up in steps, first to $62,000 and in the last few days, closer to $65,000. However, BTC buyers are facing a couple of moving averages which are acting as the last resistance indicators before they push the price to $70k.
Bitcoin Chart Daily – Can Buyers Push Above the MAs?
Bitcoin’s Recent Performance and Outlook
July and August were challenging months for Bitcoin, which has been making lower highs since reaching its all-time high in March. However, the leading cryptocurrency now appears to be heading towards $70,000 again. Bitcoin (BTC) struggled to break above $62,000 despite a significant drop in the US Dollar Index (DXY), with Bitcoin typically seen as an inflation hedge. The 50-day SMA (yellow) acted as resistance around the $62K mark.
Friday’s Surge in BTC and Federal Reserve Influence
Bitcoin’s price surged significantly on Friday afternoon, following Federal Reserve Chairman Jerome Powell’s speech at the Jackson Hole symposium, where he announced the Fed’s dovish shift and plans for monetary easing in August. Powell’s hints at potential interest rate reductions sparked a notable increase in Bitcoin demand, especially in the United States, as shown by on-chain statistics.
Impact of Lower FED Rates and Market Trends
Lower FED rates often reduce returns on traditional financial instruments like Treasury yields, which can weaken the USD. Following Powell’s speech, the USD began to decline, making cryptocurrencies more attractive to investors seeking higher yields. Analysis of Glassnode data reveals that Bitcoin’s 14-day Market-Realized Gradient is at 1.17. This metric, which indicates the length of a potential upswing or downtrend, suggests that Bitcoin has attracted significant capital, potentially driving further price increases.
Bitcoin BTC Live Chart


Sidebar rates
Related Posts
