


USDCAD Pierces 1.36 As Prices in Canada Remain High
After the strong bullish momentum in July, USDCAD experienced a bearish reversal early this month, losing 3.5 cents, and falling to the 1.36 support yesterday. The currency pair saw a sharp rise in July, but as risk sentiment improved, it started to fall, erasing all previous gains. Yesterday, the price briefly broke below the support at the 100-day SMA after a short-lived jump following softer Canadian inflation data.
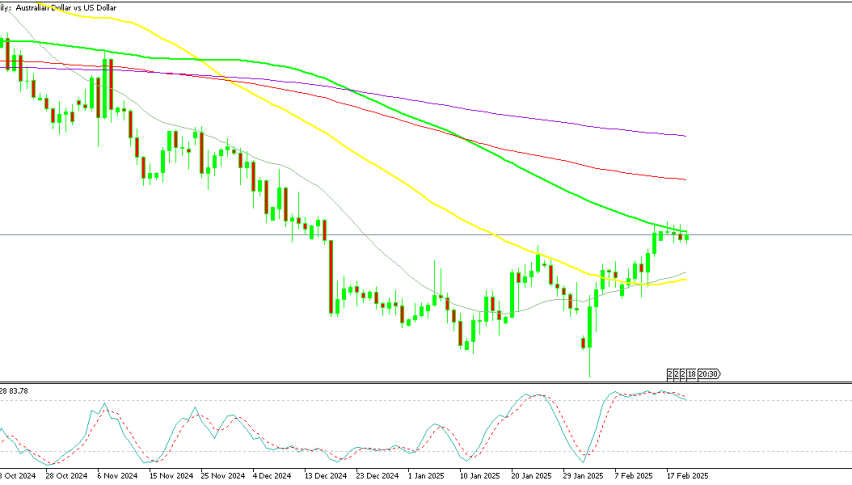
USD/CAD Chart Daily – Sellers Facing the Support Zone

However, the decline stopped right at the support zone around 1.36. Despite the declining USD/CAD ratio, driven largely by USD weakness, the Canadian dollar remains under pressure. This is due to bearish crude oil prices and the recent soft inflation data from Canada, highlighted by yesterday’s CPI report. Canada’s July CPI came in as expected at +2.5% YoY, down from the previous +2.7%. The Bank of Canada’s Core CPI YoY also decreased by 2 points to +1.7%, down from last month’s +1.9%. This data initially sent USD/CAD 30 pips higher, but the move was short-lived as sellers quickly returned, pushing the price down close to 1.36.
| Broker | Review | Regulators | Min Deposit | Website | |
|---|---|---|---|---|---|
| 🥇 |  | Read Review | ASIC, FSA, CBI, BVI, FSCA, FRSA, CySEC, ISA, JFSA | USD 100 | Visit Broker |
| 🥈 |  | Read Review | FCA, CySEC, ASIC, MAS, FSA, EFSA, DFSA, CFTC | USD 100 | Visit Broker |
| 🥉 |  | Read Review | CySEC, MISA, FSCA | USD 25 | Visit Broker |
| 4 |  | Read Review | ASIC, BaFin, CMA, CySEC, DFSA, FCA, SCB | USD 200 | Visit Broker |
| 5 |  | Read Review | ASIC, FCA, CySEC, SCB | USD 100 | Visit Broker |
| 6 | Read Review | FCA, FSCA, FSC, CMA | USD 200 | Visit Broker | |
| 7 | Read Review | BVI FSC | USD 1 | Visit Broker | |
| 8 |  | Read Review | CBCS, CySEC, FCA, FSA, FSC, FSCA, CMA | USD 10 | Visit Broker |
| 9 |  | Read Review | ASIC, CySEC, FSCA, CMA | USD 100 | Visit Broker |
| 10 |  | Read Review | IFSC, FSCA, ASIC, CySEC | USD 1 | Visit Broker |
Additionally, today’s Industrial Product Price Index (IPPI), which tracks changes in prices of goods sold by manufacturers, and the Raw Materials Price Index (RMPI), which reflects changes in prices of raw materials purchased by manufacturers, both showed declines. These factors are significantly impacting the Canadian dollar.
Canadian July 2024 Producer Price Index (PPI) and Raw Materials Price Index (RMPI)
Producer Price Index (PPI):
- Month-over-Month (m/m): Remained flat at 0.0%, aligning with the prior reading and slightly above the expected -0.3%, indicating stable producer prices without significant inflationary or deflationary pressure in July.
- Year-over-Year (y/y): Increased by +2.9%, marginally higher than the expected +2.8%, suggesting a modest rise in the overall cost of goods produced compared to last year.
Raw Materials Price Index (RMPI):
- Month-over-Month (m/m): Rose by +0.7%, a notable recovery from the previous month’s decline of -1.4%, possibly reflecting higher costs for raw materials due to market fluctuations or supply constraints.
- Year-over-Year (y/y): Increased by +7.7%, up from +7.5% previously, indicating continued upward pressure on raw material costs, which could eventually translate into higher consumer prices.
These figures highlight ongoing inflationary pressures within the Canadian economy, particularly at the raw materials level, which could have implications for future pricing and economic policy. The PPI report revealed a mixed picture, with energy and petroleum product prices rising by 2.0%, while lumber and other wood products saw a 3.4% decline. Excluding energy and petroleum products, the PPI actually fell by 0.2%. However, as we approach a period where oil prices are expected to drop by $10 to $20 annually, this shift is likely to have a substantial impact on global inflation measures.
USD/CAD Live Chart


Add 3442

Related Posts
Add 3440


🏆 7 Best Forex Brokers
| Broker | Website | |
|---|---|---|
| 🥇 | | Visit Broker |
| 🥈 | | Visit Broker |
| 🥉 | | Visit Broker |
| 4 | | Visit Broker |
| 5 | | Visit Broker |
| 6 | Visit Broker | |
| 7 | Visit Broker |
