Will The GameStop Stock Recover Or Is There More Downside?

GameStop Stock Is Trending Lower
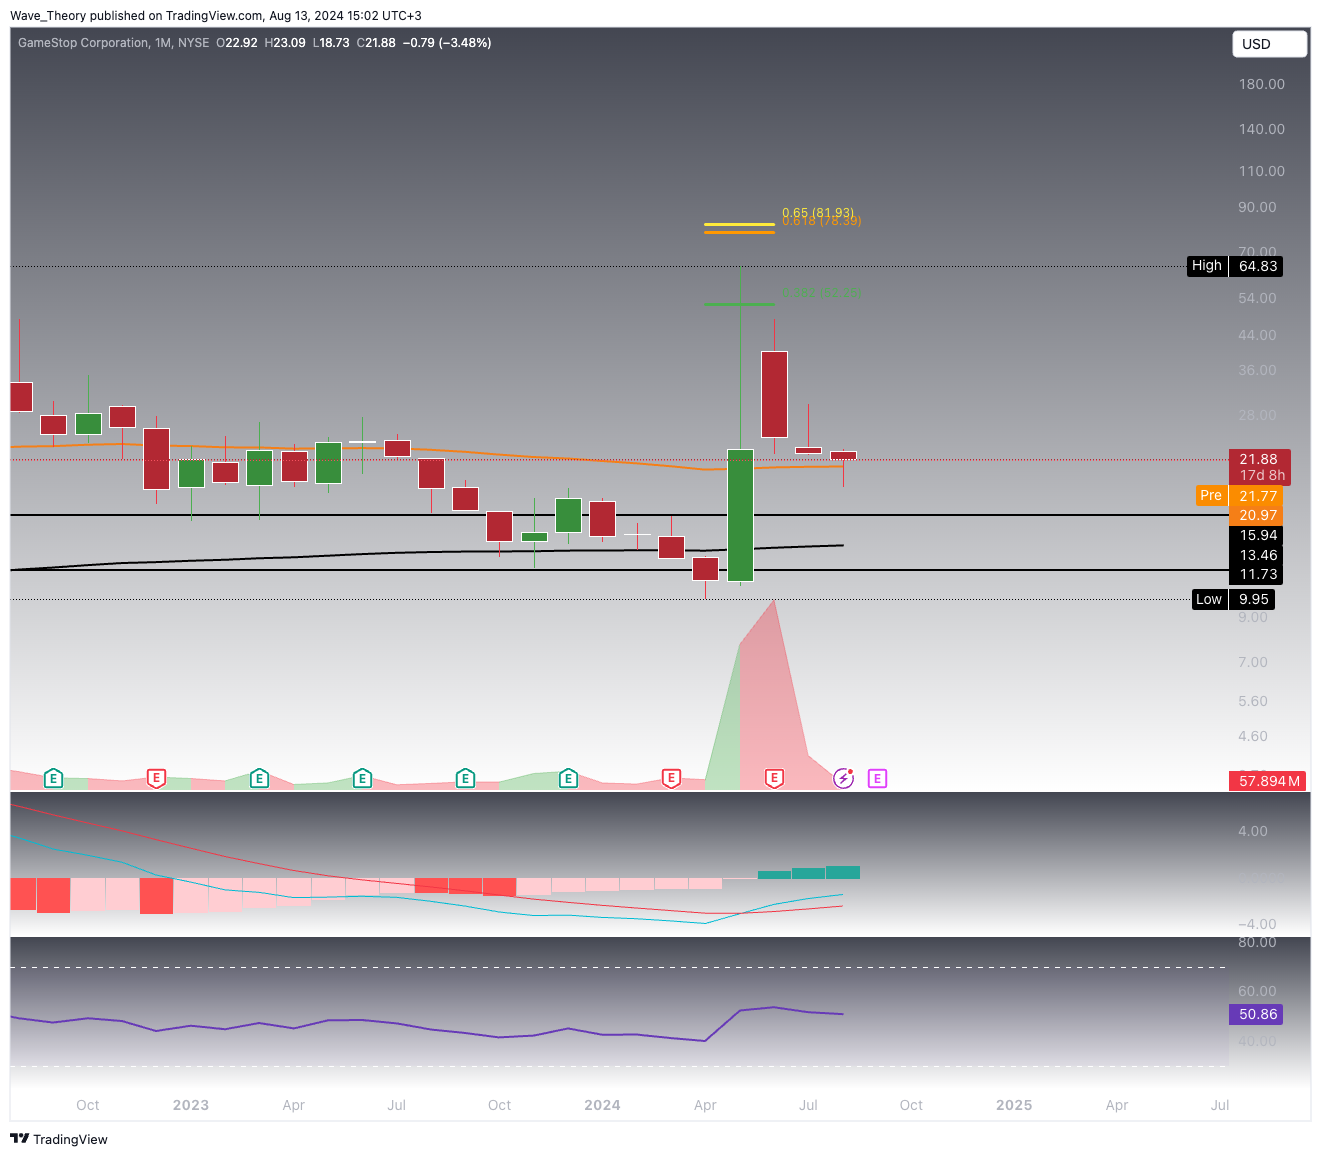
The GameStop (GME) stock has been undergoing a steep correction over the past three months, following an impressive surge of more than 500% in May. Despite this significant rally, GME was unable to sustain momentum above the crucial Fibonacci resistance at $52.25, which led to a sharp reversal.
Currently, GME has found substantial support at the 50-month EMA, hovering around the $21 level. While the stock continues to experience downward pressure, the technical indicators suggest a bullish outlook. The price action near the 50-month EMA, combined with the broader context of the correction, indicates potential for a reversal or stabilization, hinting at an emerging opportunity for a rebound in the near term.
Technical Indicators and Trends (Monthly Chart)
- MACD (Moving Average Convergence Divergence): The MACD lines have crossed bullishly and the histogram shows an upward trend.
- RSI (Relative Strength Index): The RSI is in neutral territory, providing no clear bullish or bearish signals.
- EMA (Exponential Moving Average): The golden crossover of the EMAs confirms a bullish trend in the long term.
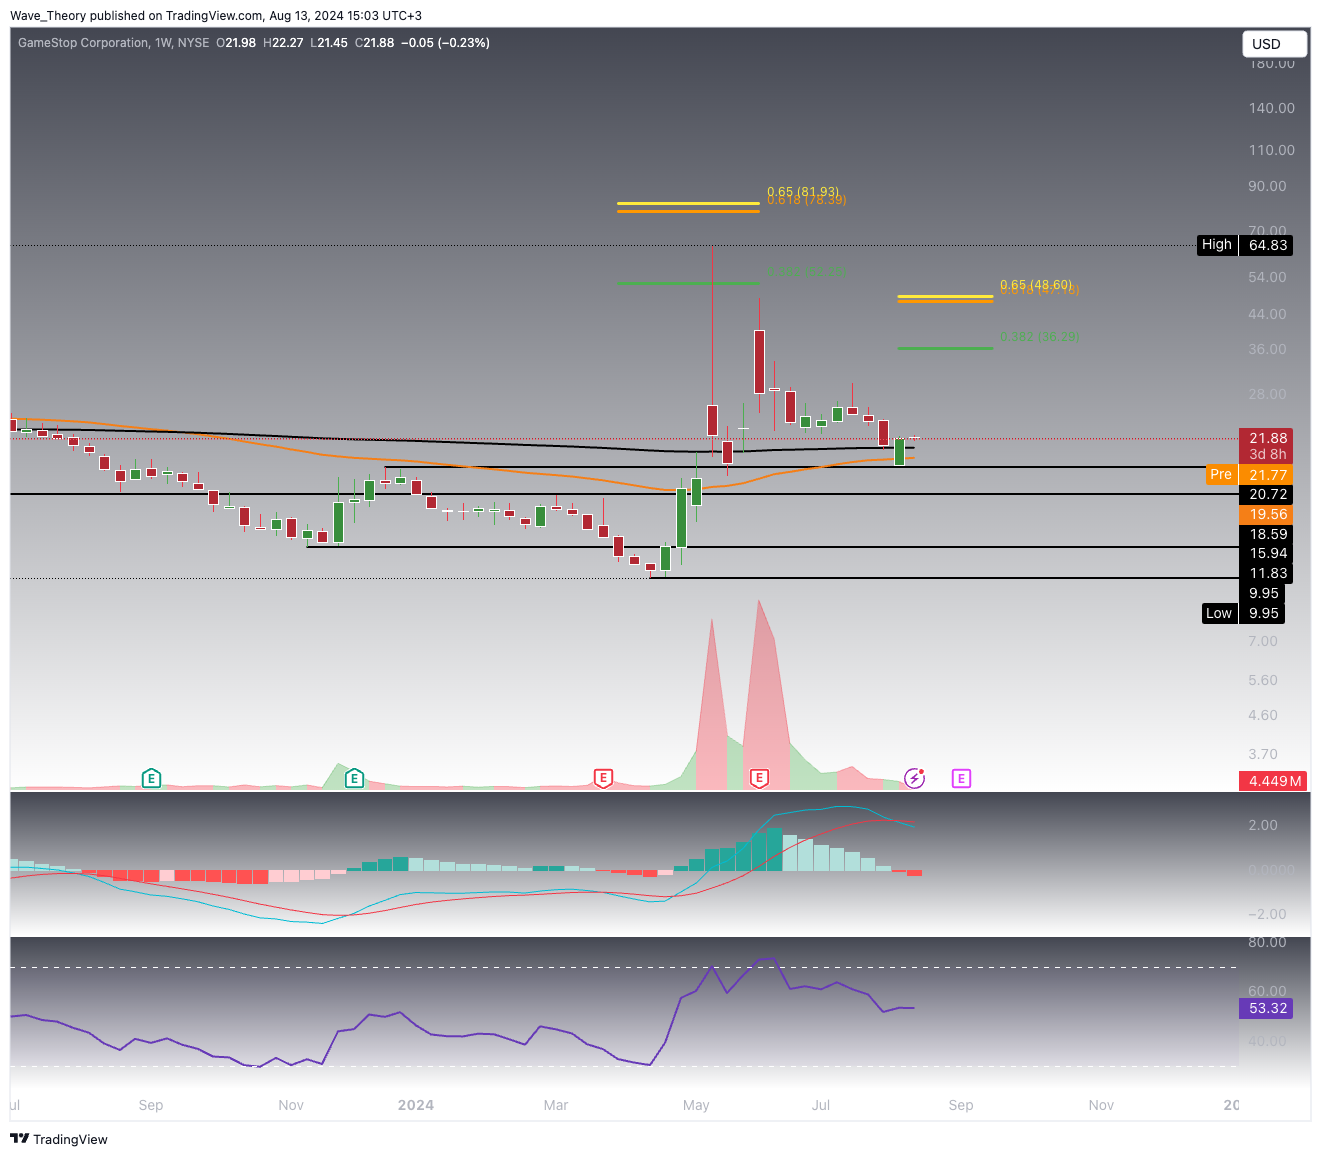
The Previous Week Was Very Bullish for GameStop (GME)
GameStop (GME) stock demonstrated significant strength last week, rebounding off the horizontal support at $20.72 and rallying over 18%. Despite this impressive move, GME remains entrenched in its ongoing correction phase.
To confirm a reversal and mitigate the risk of further declines, GME must decisively break through the key Fibonacci resistance levels at $36.30 and $48.50. If the downtrend persists, the stock has substantial support in the $18.60 to $20.70 range, which could serve as a crucial support for any continued bearish pressure.
Technical Indicators and Trends (Weekly Chart)
- MACD (Moving Average Convergence Divergence): The MACD lines have crossed bearishly and the histogram shows a bearish trend.
- RSI (Relative Strength Index): The RSI oscillates in neutral territory, providing neither bullish nor bearish signals.
- EMA (Exponential Moving Average): The EMAs formed a death cross, confirming the trend bearishly mid-term.
GameStop (GME): Key Resistance Levels to Watch
Should GME sustain its current upward momentum, it will encounter significant Fibonacci resistance levels around $23 and $26. Additionally, the 50-day EMA serves as another critical resistance point, aligning closely with the $23.30 level. These barriers are crucial for GME’s ability to continue its ascent, and traders should monitor price action closely as it approaches these resistance levels.
Technical Indicators and Trends (Daily Chart)
- EMAs: The golden crossover of the EMAs in the daily chart indicates a short to medium-term bullish trend.
- MACD: The MACD histogram is ticking bullishly higher, with the MACD lines potentially establishing a bullish crossover.
- RSI: The RSI provides no definitive bullish or bearish signals.

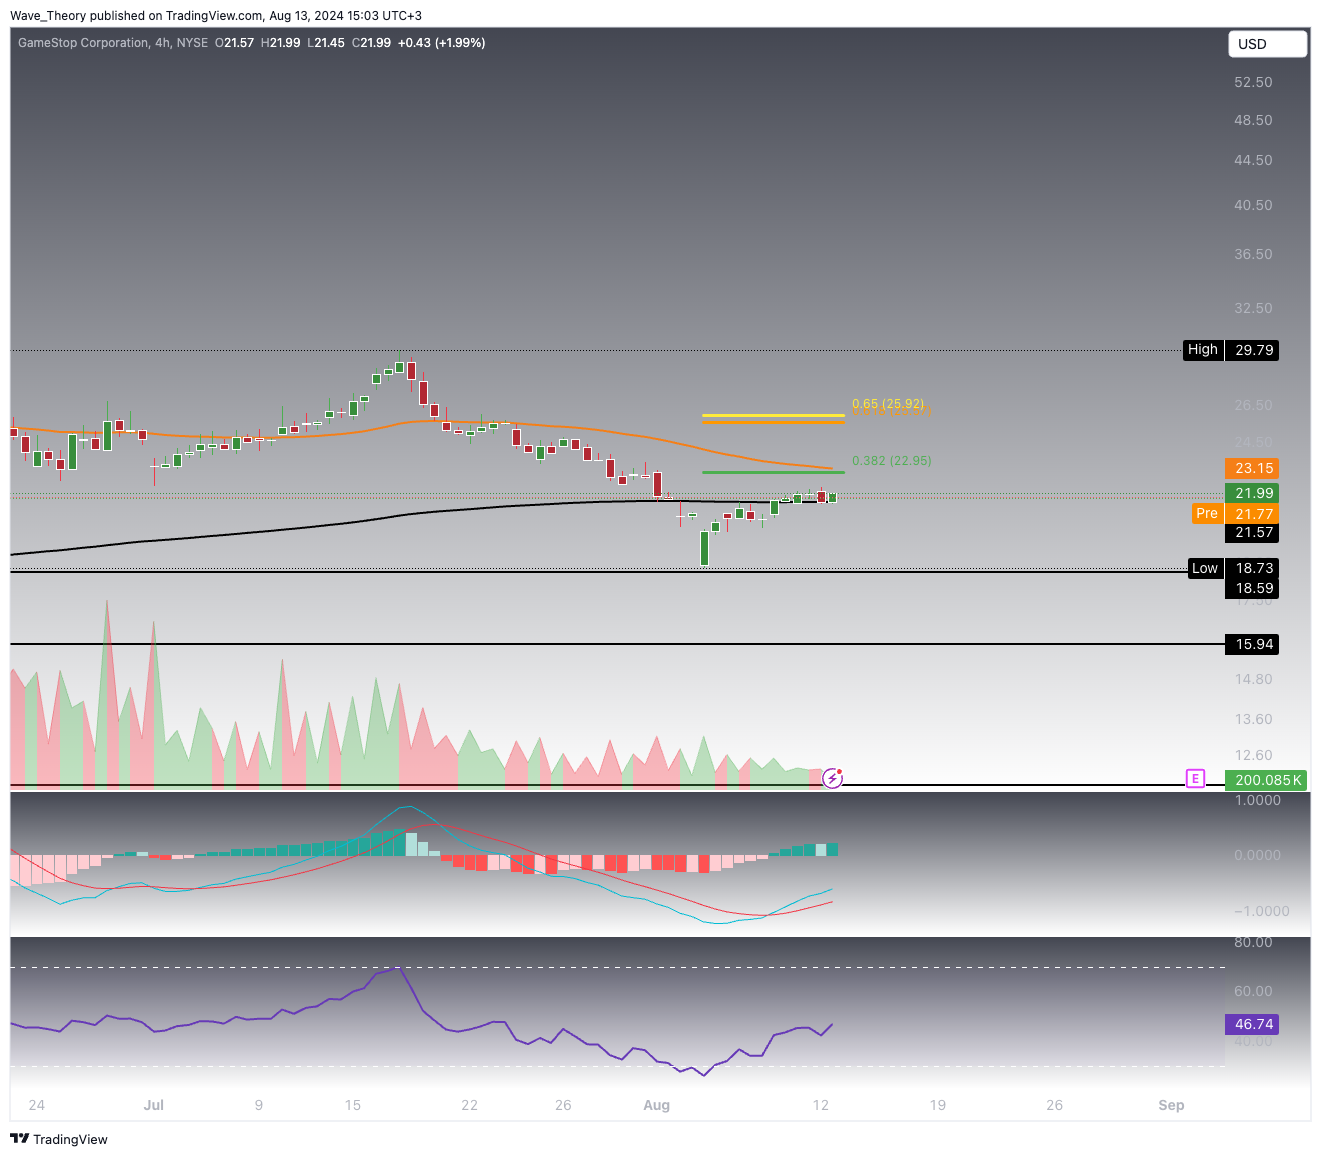
The GameStop Stock Looks Bullish In The Short-Term
In the 4H-Chart, the GME stock looks rather bullish.
Technical Indicators and Trends (4H Chart)
- EMAs: The golden crossover of the EMAs on the 4H chart signals a short-term bullish trend, suggesting potential upward momentum in the near term.
- MACD: The MACD lines are bullishly crossed, with the histogram ticking progressively higher, further reinforcing the bullish outlook.
- RSI: The RSI, however, remains neutral, offering no clear bullish or bearish signals at this stage.
This technical analysis outlines a cautiously optimistic outlook for GameStop (GME) in the short to medium term. While the stock shows signs of a potential bullish reversal, significant resistance levels must be overcome to confirm a sustained uptrend. The broader correction phase is still in play, with crucial support levels acting as a buffer against further declines.
Summary
- Short-term Outlook: Bullish, with key resistances at $23, $26, and $36.3.
- Medium-term Outlook: Correction phase persists, but significant support between $18.6 and $20.7 provides a potential floor.
Key Levels to Watch:
- Support: $18.6 – $20.7, 50-month EMA around $21
- Resistance: $23 – $23.3, $26, $36.3, $48.5
- Check out our free forex signals
- Follow the top economic events on FX Leaders economic calendar
- Trade better, discover more Forex Trading Strategies
- Open a FREE Trading Account
Related Articles

Comments
Sidebar rates
Related Posts
