Forex Signals Brief August 7: Following the Market Mood Today
Today the Employment Repot from New Zealand was already released, so we are looking at risk sentiment for direction in markets.

Yesterday, the RBA opened the day, maintaining interest rates at 4.35% and refrained from hinting at a future rate hike, which provided support for the Aussie dollar. However, they did remove the rate hike passage from their statement. After Monday’s market bloodbath, the markets rebounded on Tuesday. The Nikkei, which had fallen more than 12% on Monday, recovered over 10%, setting the stage for a bullish opening in the US share market.
Shares did open higher, and buyers stepped in, pushing the major indices upwards. However, late-day selling in the final hour reduced some of the gains from the rally. In the forex market, the AUD and CAD closed as the strongest among the major currencies, while the USD ended the day mixed.
Today’s Market Expectations
Today the main economic event is already behind us, so the sentiment will drive financial markets. The Employment Report for June from New Zealand was released early in the morning, with expectations of a 4-point jump in the unemployment rate. New Zealand’s employment report for June shows a Q2 unemployment rate of 4.6%, slightly better than the expected 4.7%, though up from Q1’s rate of 4.3%. The participation rate in Q2 increased to 71.7%, exceeding expectations of 71.3% and up from the previous rate of 71.55%. Additionally, the labour cost index rose by 0.9% in Q2, higher than the anticipated 0.8%, and up from Q1’s increase of 0.8%.
During the European and US sessions, the data calendar is light, with the German Industrial Production expected to turn positive and show a 1.0% increase in July, after three negative moths which will be welcomed by the Euro. In the US session we have the Canadian Ivey PMI which is expected to slow slightly to 60 points but that remains a decent level of expansion, while the EIA crude Oil inventories will close the day.
Yesterday the volatility slowed compared to Monday, so the price action in the financial markets was slower. We opened six trading signals in total, but ended up with four closed signals. Three of them were winning forex signals with just one losing trade, so it was another positive trading day.
Gold Continues Lower Below $2,400
Gold nearly reached its all-time high from last month on Friday but then reversed and fell below $2,400 today. Fortunately, the 50-day Simple Moving Average (SMA) halted the drop. After failing to maintain its gains, gold declined further. It held steady during the European and Asian sessions yesterday but sank dramatically during the US session, extending the downward trend in stocks that began last Friday. It fell 3% on the day, or almost $80, reaching a low of $2,364.30. On the daily chart, the retreat stopped abruptly at the 50-day SMA, which has been providing support since the end of July. Encouragingly, gold buyers entered the market early, with XAU quickly rebounding more than $50, pushing the price back above $2,400. This swift recovery is a positive sign for gold’s momentum.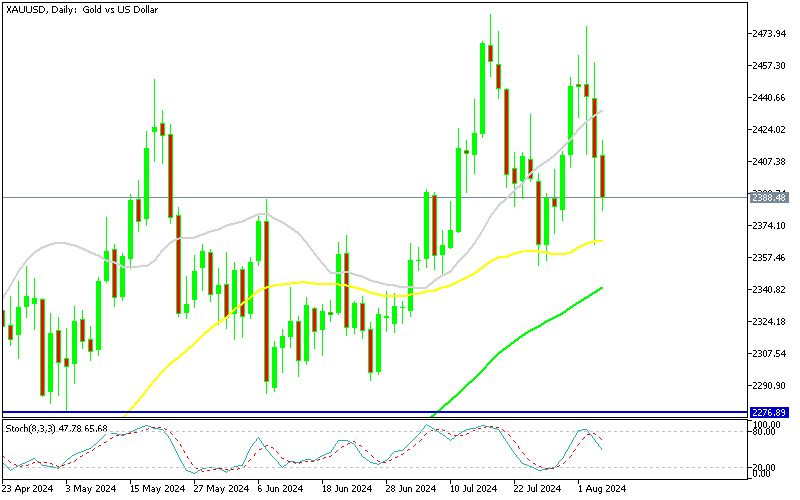
XAU/USD – Daily chart
AUD/USD Stays Close to 0.65
After hitting new 2024 lows of 0.6349 on Monday, the AUD/USD recovered some ground, rebounding above the 0.6500 mark on Tuesday and returning to the consolidation zone. This recovery was also aided by a comeback in commodity prices, particularly copper and iron ore. Following the Reserve Bank of Australia (RBA) policy announcement, AUD/USD saw some bids when Governor Bowman stated that the board had discussed hiking interest rates. However, the Australian dollar is widely regarded as a risk currency, and with China slowing and stock markets volatile and declining, a risk-off mood prevails. These competing pressures have resulted in the current consolidation around 0.65.
AUD/USD – Daily Chart
Cryptocurrency Update
Bitcoin Facing the Previous Support As Resistance Now

BTC/USD – Daily chart
Ethereum Touches $2,500 Again
Since early March, Ethereum has been trading at lower highs, signaling an impending negative trend despite the introduction of an ETH ETF. In June, Ethereum’s price dropped below $3,000 after peaking at $3,830. Buyers re-entered the market, pushing the price above the 50-day SMA, which had previously acted as a resistance level. However, as the decline intensified over the past few days, we witnessed another bearish reversal that drove ETH below the 200 SMA, continuing the sequence of lower highs. Yesterday, the price touched $2,000 before rebounding past $2,400.
ETH/USD – Daily chart
- Check out our free forex signals
- Follow the top economic events on FX Leaders economic calendar
- Trade better, discover more Forex Trading Strategies
- Open a FREE Trading Account
Related Articles


Comments
Sidebar rates
Related Posts
