Forex Signals Brief July 29: Three CB Meetings, 1 Rate Cut Expected
This week the Bank of Japan, the Bank of England and the FED will hold meeting, but only the BOE is expected to cut rates by 25 bs
Last week the attention was on the US PCE price index report, as well as on the Q2 GDP figures, but in the end, they didn’t offer much in terms of price action, while all the volatility came from the earnings reports of two major multinationals. The Q2 GDP came in at 2.8%, but a 0.74% increase in inventories, so the real GDP was closer to 2.0%, similar to Q1 which came in at 1.4%, but with a 0.6% decline in inventories, which when added, it would account to around 2% as well. The PCE index was also little changed, apart from the headline numbers which ticked to 2.6% in June from 2.5% previously.
The earnings reports of Alphabet and Tesla were disappointing for Q2, sending their stocks lower, which scared investors and pulled lower major US indices, particularly the tech-heavy Nasdaq index which tumbled around 3.5% lower. Risk sentiment remained largely negative throughout the week, keeping commodity dollars bearish.
This Week’s Market Expectations
This week the Bank of Japan, the Bank of England and the FED will hold meeting, but only the BOE is expected to cut rates by 25 bs.
Upcoming Events for the Week 29 July – 4 August 2024
Monday
- US Treasury Refunding Financing Estimates
Tuesday
- Japan Unemployment Rate
- Eurozone Flash Q2 GDP
- US Job Openings
- US Consumer Confidence
Wednesday
- Japan Industrial Production and Retail Sales
- Australia CPI
- Chinese PMIs
- BoJ Policy Decision
- Eurozone Flash CPI
- US ADP Employment Report
- Canada GDP
- US Employment Cost Index (ECI)
- FOMC Monetary Policy Meeting
Thursday
- China Caixin Manufacturing PMI
- BoE Policy Decision
- US Jobless Claims
- Canada Manufacturing PMI
- US ISM Manufacturing PMI
Friday
- Swiss CPI
- US Non-Farm Payrolls (NFP)
Last week the volatility was low in the forex market, with the US GDP and PCE index not offering much as they came close to expectations, but there was a lot of drama in the stock markets. We opened 29 trading signals, mostly in stocks since we also had a glitch in the forex feed, and ended up with 20 winning forex signals and 9 losing ones.
Gold Rebounds Off the 50 SMA
In the last two days of the previous week, gold prices experienced an increase during the early US trading session, climbing from $2,400 to a peak of $2,430. This rise was part of a broader movement towards safe-haven investments, driven by investors seeking stability following declines in global stock markets. However, despite surpassing the 50-day Simple Moving Average (SMA), gold couldn’t sustain its upward momentum. The price reversed, forming a doji candlestick—a bearish reversal signal—indicating potential downside. Later in the session, the XAU/USD pair fell back to its previous range, dropping below the 100-day SMA and dipping under $2,400.
XAU/USD – H4 chart
AUD/USD Stretches the Downside Move
AUD/USD pair has been declining over the past two weeks, largely due to concerns about slowing economic growth in China, which heavily impacts Australia’s export-driven economy. After re-entering its trading range last week, the AUD/USD pair accelerated its decline. The 100-day moving average, currently at 0.66 was broken and the pair fell to 0.65 on Thursday.
AUD/USD – Daily Chart
Cryptocurrency Update
Bitcoin Resumes the Upside Momentum
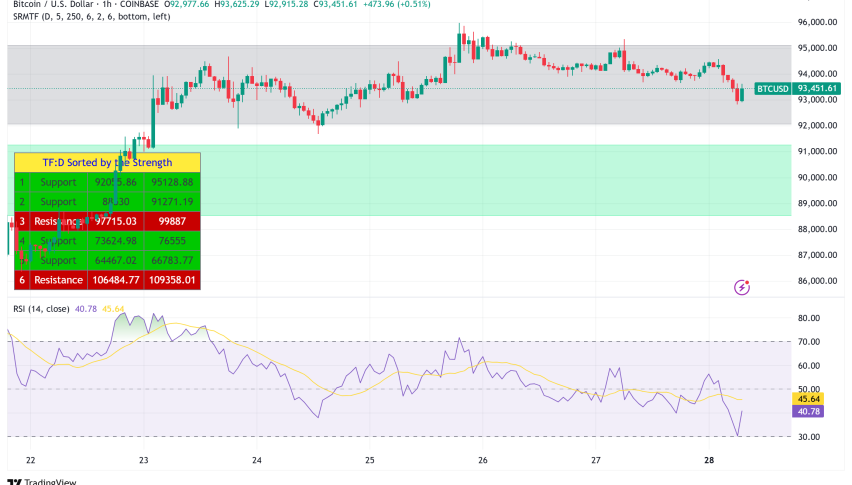
We continue to hold a long position on Bitcoin, maintaining a buy signal, while observing if buyers can push the price beyond $70,000. Over the weekend, former President Donald Trump downplayed concerns that Bitcoin could threaten the US dollar’s dominance, promising to make the United States the “crypto capital of the planet.” Following his comments, Bitcoin’s price briefly dropped $2,000 from $68,500 before rebounding to $69,000.
BTC/USD – Daily chart
The 200 SMA Holds As Support for Ethereum
Ethereum, despite the launch of an ETH ETF, the cryptocurrency has been experiencing a series of lower highs since early March. After reaching a high of $3,830, Ethereum’s price fell below $3,000 in June. Buyers returned to the market, pushing the price back above the 50-day SMA, which had previously acted as resistance. Last week we saw another retreat, but the 200 daily SMA (purple) held as support.
ETH/USD – Daily chart
- Check out our free forex signals
- Follow the top economic events on FX Leaders economic calendar
- Trade better, discover more Forex Trading Strategies
- Open a FREE Trading Account
Related Articles
Comments
Sidebar rates
Related Posts
