Netflix Q2 2025 Earnings Report: Key Highlights and Analysis


Netflix Inc., a leading entertainment services company based in California, specializing in paid streaming and film and series production, is set to announce its Q2 2024 earnings on July 18th (Thursday) after market close. Ranked as the world’s 33rd most valuable company by market cap, Netflix remains a dominant player in the streaming service market.
Netflix Subscriber Growth
Netflix boasts 269.6 million subscribers worldwide, surpassing Wall Street’s estimate of 264.2 million. This represents a 3.58% increase from the previous quarter and nearly 16% year-over-year growth. Factors contributing to this growth include a consistent slate of programming, crackdowns on password sharing, and the introduction of a lower-cost ad-supported tier. Netflix plans to further expand its advertising business and continue creating a steady stream of hit shows, films, and games.
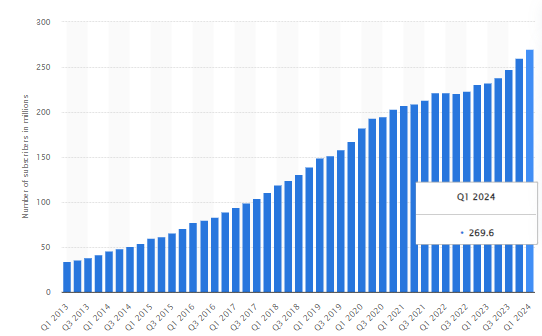
In the US and Canada, Netflix’s average revenue per user (ARPU) stands at $17.30, up nearly 4% from $16.64 last quarter and almost 7% from $16.18 in the same period last year. ARPU is a key indicator of long-term profitability, and Netflix’s ad strategies suggest there is still potential for further ARPU growth, enhancing overall revenue and profitability.
Netflix Financial Performance
In the previous quarter, Netflix reported $9.37 billion in revenue, up 6.1% from the previous quarter and 14.8% year-over-year. Operating income rose 53.6% year-over-year to $2.6 billion, with net income increasing by 79% to $2.3 billion. As a result, the operating margin increased to 28.09% and the net margin to 24.89%, the highest since Q1 2022.
Netflix projects sales revenue of $9.53 billion for the upcoming quarter, a 1.7% increase from the previous quarter and 16.4% year-over-year. However, due to “typical seasonality,” operating profit and net income are expected at $2.54 billion and $2.09 billion, respectively. Operating and net margins are also set to decrease to 26.66% and 21.87%.
Earnings per share (EPS) are estimated to be $4.74, down 11% from $5.28 in the previous quarter but up from $3.29 in Q2 2023.
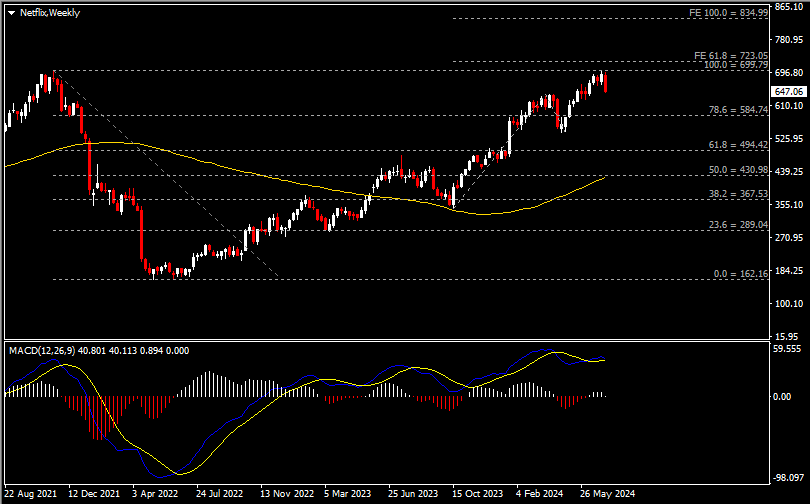
Technical Analysis of Netflix Shares
Netflix’s share price has pulled back from its November 2021 high of $699.79. Strong resistance is noted at the all-time high (ATH) and the 61.8% Fibonacci Extension (FE) level at $723. Meanwhile, the MACD indicator is signaling a potential bearish crossover, with a contracting bullish histogram indicating waning momentum. A technical correction could focus on support levels at $585 (78.6% Fibonacci Retracement from ATH to May 2022 lows) and $494 (61.8% Fibonacci Retracement).
- Check out our free forex signals
- Follow the top economic events on FX Leaders economic calendar
- Trade better, discover more Forex Trading Strategies
- Open a FREE Trading Account
Related Articles
Comments
Sidebar rates
