Polkadot (DOT) Price Read to Surge? Analysts Eye Breakout
Polkadot (DOT) defied the recent crypto market slump, emerging as the top gainer among the top 20 cryptocurrencies. At the time of writing,
Polkadot (DOT) defied the recent crypto market slump, emerging as the top gainer among the top 20 cryptocurrencies. At the time of writing, DOT is trading at $5.96.
Several factors are fueling optimism for a continued DOT price rise:
- High Liquidity Zones: Analysis of the Liquidation Heatmap indicates high liquidity levels between $6.45 and $6.96. This suggests that if buying pressure surges, DOT’s price could surge towards $7 or even higher.
- Shifting Sentiment: Polkadot’s Weighted Sentiment has swung positive, indicating growing confidence in the project’s potential. This positive perception could translate to higher demand for DOT.
- Rising Open Interest: Open Interest in DOT futures contracts has risen, reflecting increased investor participation and potentially foreshadowing a price hike.
- Analyst Predictions: Analysts like Captain Faibik believe DOT is on the verge of a breakout, suggesting a significant price increase in the near future.
Polkadot Treasury Concerns
The Polkadot Treasury’s high spending rate has drawn criticism from the community, with concerns about the project’s long-term financial sustainability. Despite these concerns, DOT’s staking rewards mechanism helps replenish the Treasury, mitigating the risk of complete fund depletion.
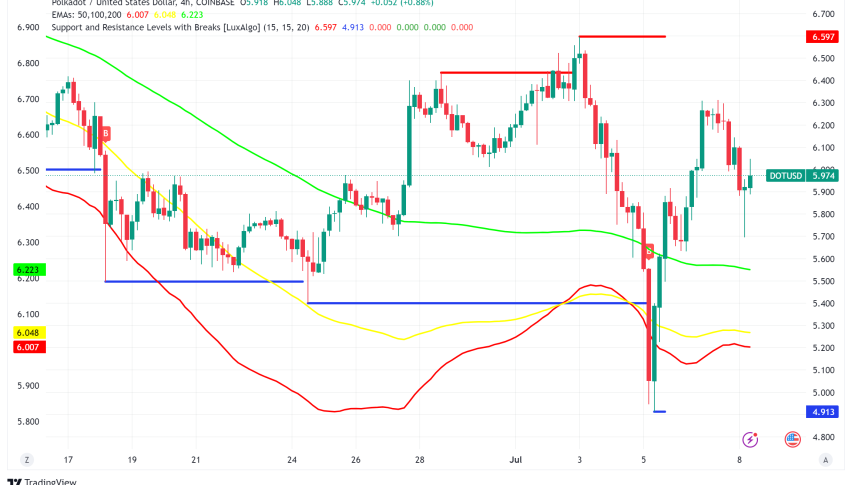
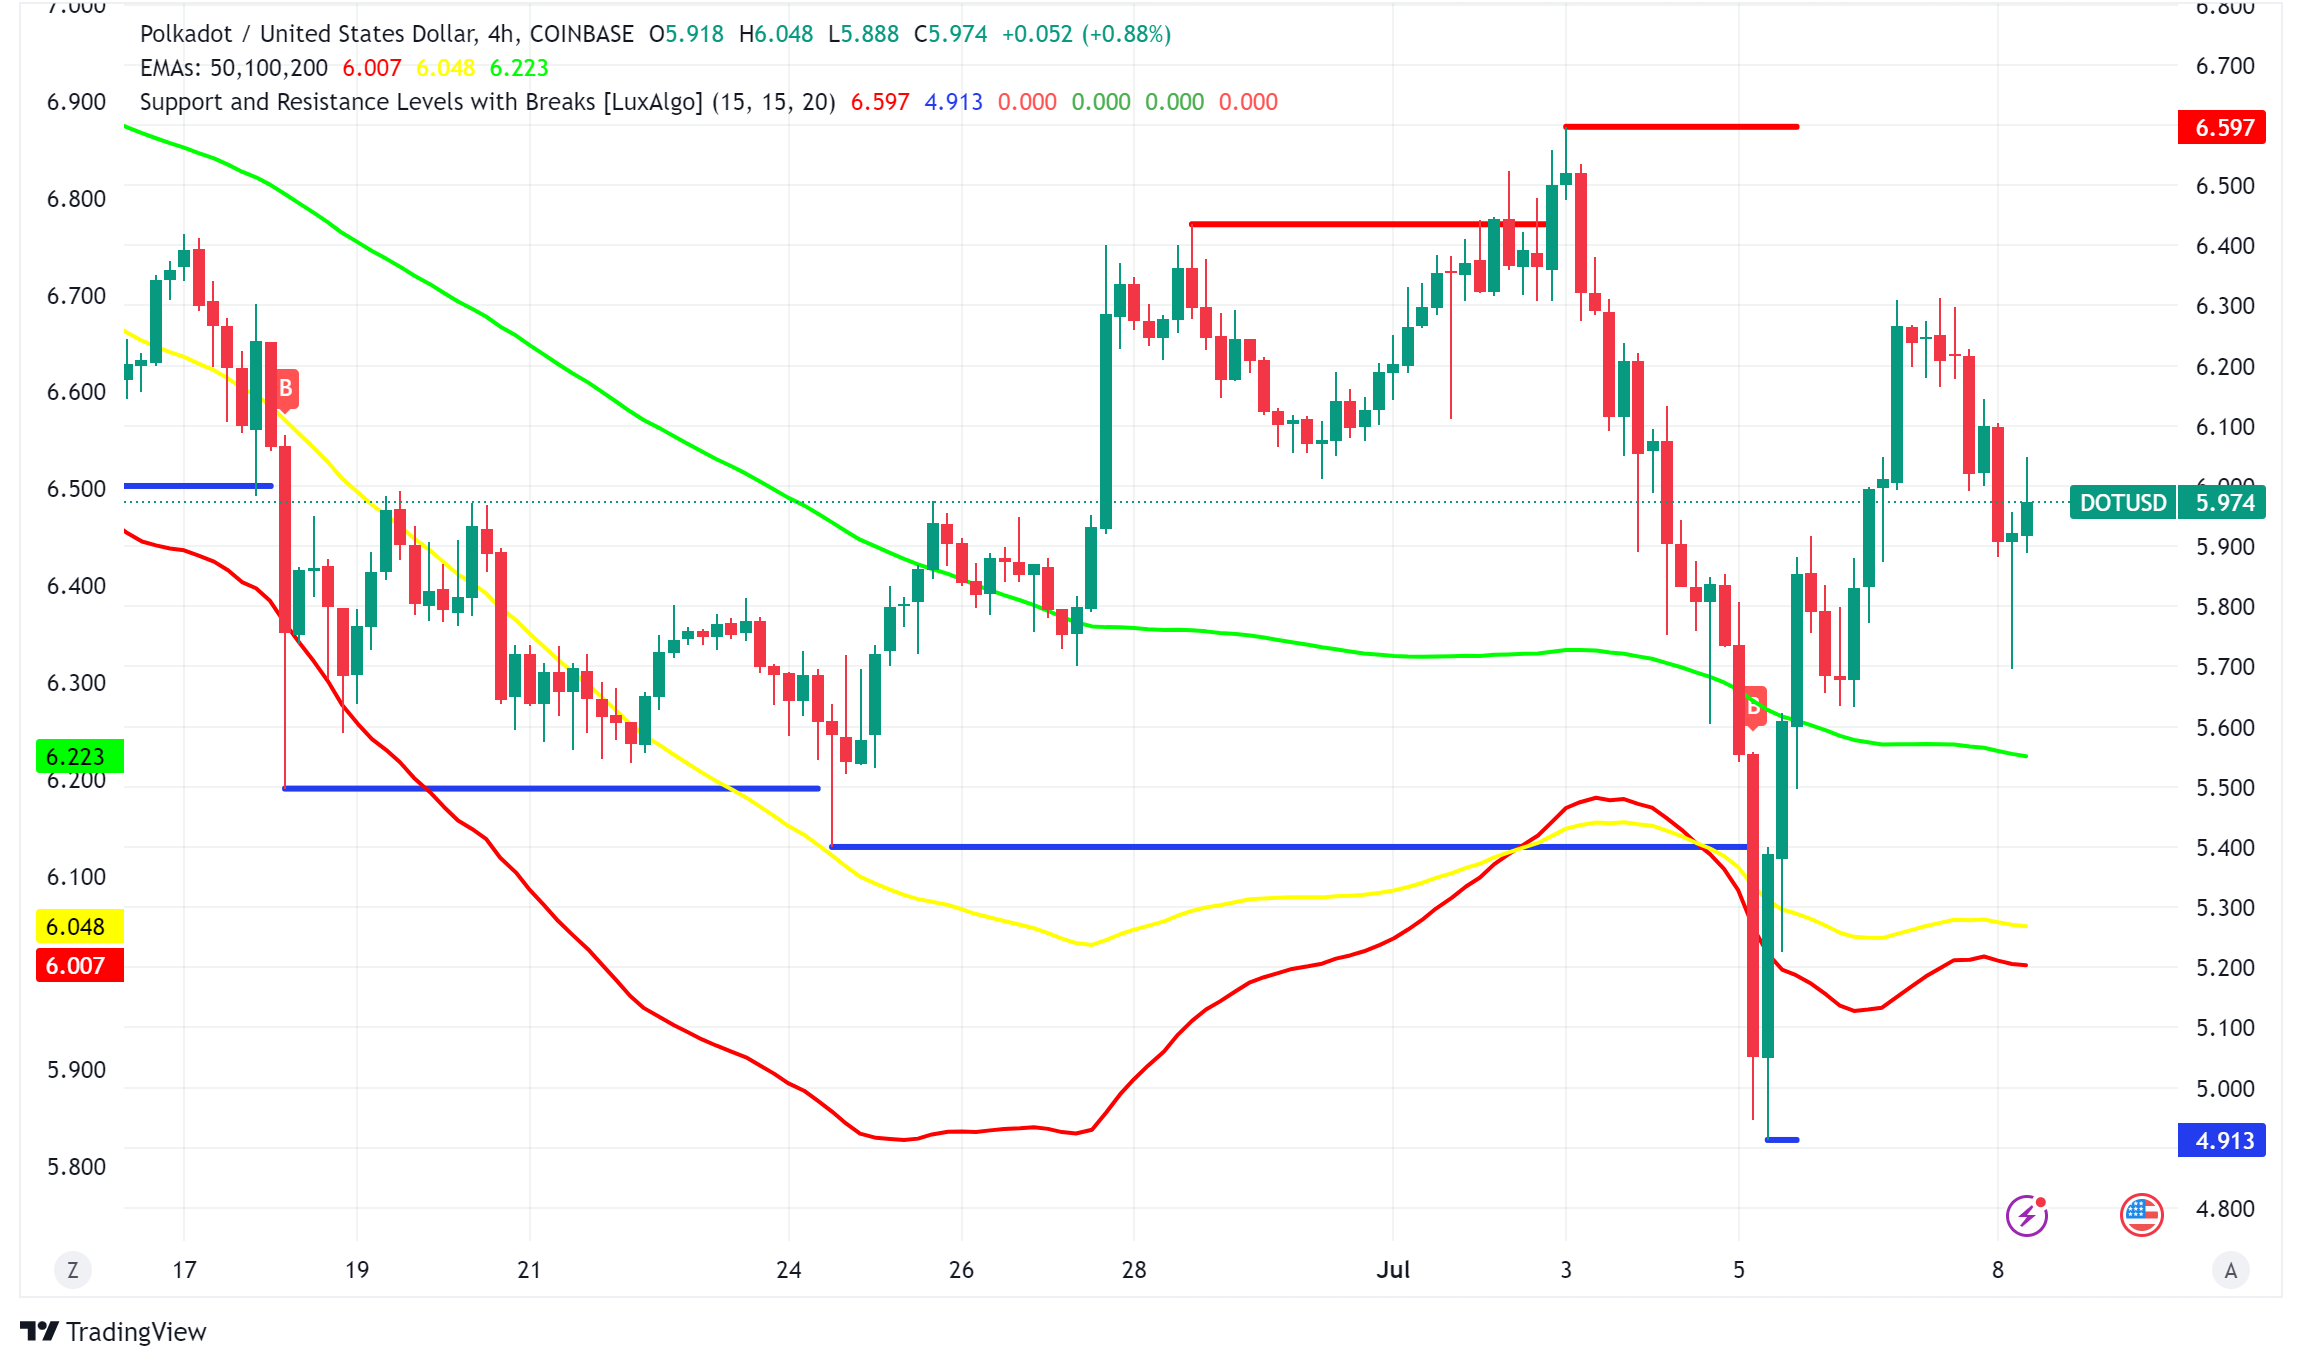
DOT/USD Technical Analysis
The bulls appear to be regaining control, with DOT successfully breaching the 20-day EMA ($6.08). If the price surpasses the 50-day SMA ($6.54), a rally towards $7.29 and potentially $7.77 could materialize. Conversely, a drop below the $5.38 – $4.91 support zone would signal a bearish turn.
The 4-hour chart exhibits a V-shaped recovery from recent lows. A surge above $6.60 could propel DOT towards $7.29. However, a decline below the 20-EMA suggests potential weakness, with a retest of the $4.91 support level a possibility.
Recent Price Movements
- DOT had fallen to $4.91 on July 5th but has since recovered.
- Despite initial selling pressure after surpassing $6, DOT has managed to maintain an upward trajectory.
- While the broader market downturn caused a 16% decline in DOT’s price over the past month, the current surge suggests a potential reversal.
- Check out our free forex signals
- Follow the top economic events on FX Leaders economic calendar
- Trade better, discover more Forex Trading Strategies
- Open a FREE Trading Account
Related Articles
Comments
Sidebar rates
Related Posts
