Forex Signals Brief July 4: Quiet Markets for US Independence Day
Today US markets will be closed for the 4th of July, so we expect volatility to dry off as we head into the US session.

Yesterday it started off in the Asian and European session, however the retail sales report from Australia showed a nice jump for May, which kept the Aussie in demand all day. However, the bullish break in this pair came during the US session, after the data from the US was released, which sent the USD tumbling lower.

The USD/JPY pair initially dropped following the release of the ISM report, crossing below the 100-hour moving average for the first time since June 14. This move should have accelerated downward momentum, and it did initially, but the decline halted near the week’s low (Monday), and the price subsequently moved higher.
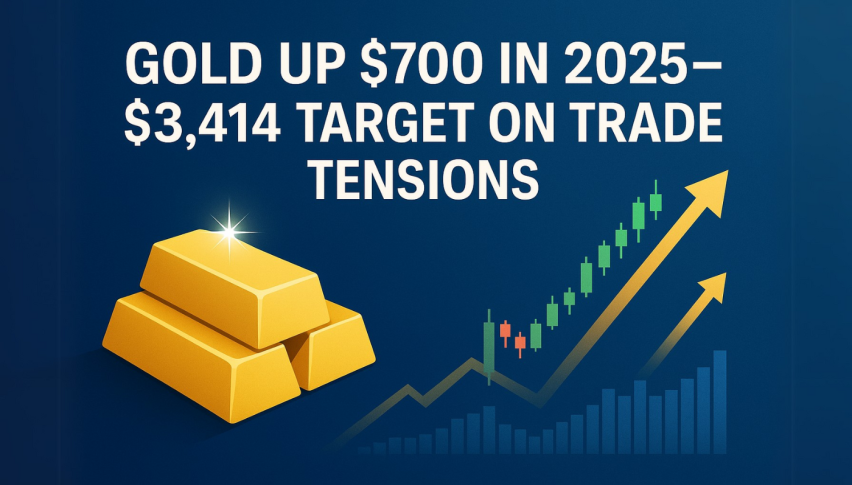
WTI crude oil prices rose by $0.92 after a significantly larger-than-expected decrease in oil stockpiles, closing at $83.72, up 1.11%. Gold prices surged by $25.75, or 1.10%, reaching $2,354.87, driven by lower interest rates and a weaker US dollar. The US dollar weakened after disappointing ADP payroll data, which was followed by significantly weaker ISM non-manufacturing data (48.8 vs 52.5 expected) and industrial orders (-0.5% vs 0.2% expected).
The ISM statistics revealed the lowest levels since the post-pandemic recovery began four years ago. The employment component remained below 50 for the fifth consecutive month, and new orders fell from 54.1 last month to 47.3 this month. Five of the nine ISM components were below 50. US interest rates and the US dollar fell sharply following the release, with the longer end of the yield curve moving the most. With the US bond market closing early for the Independence Day holiday, the 10-year yield ended at 4.354%, down 8.1 basis points.
Today’s Market Expectations
Today markets are expected to remain quiet, as US markets will be closed in observance of Independence Day. However, we have the general elections in the UK, which might induce some volatility in GBP pairs late in the day as the results start to come out.
The Swiss Consumer Price Index (CPI) is forecasted to show a year-over-year increase of 1.4%, consistent with last year’s rate. The month-over-month measure is expected to rise by 0.1%, compared to 0.3% in the previous year. Recently, the Swiss National Bank (SNB) reduced interest rates by 25 basis points, bringing them down to 1.25%, and lowered its inflation forecasts.
The SNB also signaled a willingness to intervene in the foreign exchange market if necessary, particularly if inflation exceeds their projections in the third quarter. The Bank of England (BOE) anticipates that inflation will edge up slightly, averaging 1.5% in Q3. This serves as a benchmark for monitoring inflation trends. Should Swiss inflation fall short of expectations, it could prompt further actions from the SNB.
Yesterday was quiet art first but volatility kicked in during the US session. The price action was mixed though, with risk assets being quiet early but reversing in the US session and sending stock markets higher. We opened 8 trading signals yesterday, ending the day with 7 closed trades, 5 of which were winning forex signals and two were losing signals.
Gold Buyers Testing the 50 Daily SMA
The gold price turned bullish yesterday after the soft US data, with XAU pushing above the 50 daily moving averages that’s been acting resistance, offering decent selling opportunities. In the US session, the USD fell after poorer ADP payroll data, which was followed by significantly weaker ISM non-manufacturing data, which sent Gold climbing higher by $25.75, or 1.10%, to reach $2354.87.
XAU/USD – Daily chart
Looking to Buy AUD/USD at the 200 SMA on A Pullback
The AUD/USD pair has been confined to a 1-cent range for the past two months, but a breakout occurred yesterday following the release of the US ISM services report. The data revealed that activity contracted in June, hitting its lowest level since the pandemic in 2020. This fueled market concerns about a potential downturn in the US economy, as various sectors are showing signs of weakness. Consequently, yesterday’s data had a substantial impact on the market. Since late April, AUD/USD has been oscillating between the 100 SMA (red) at the bottom and the 200 SMA (purple) at the top. However, the breakout took place yesterday, as noted in the previous article, because the price had been hovering near the top of the range for an extended period. Today, Australia’s Goods Trade Balance data was released, which was expected to indicate a slowdown in June.
AUD/USD – H4 Chart
Cryptocurrency Update
Bitcoin Finding Resistance at MAs
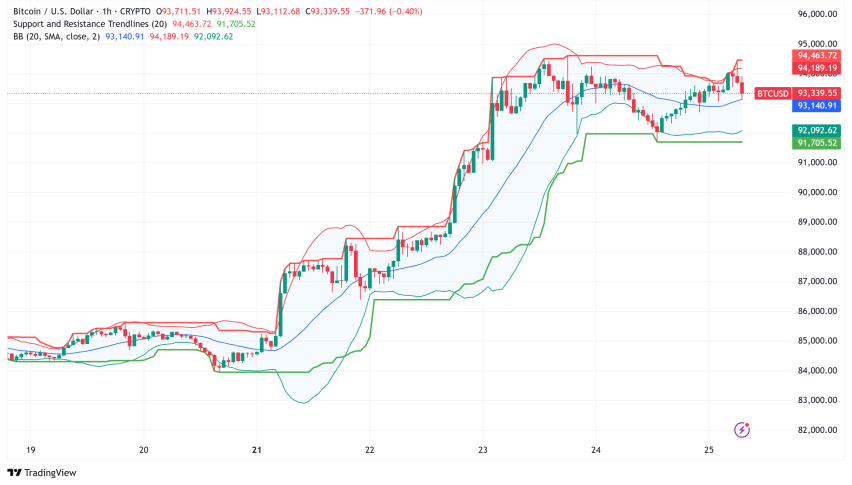
Bitcoin has been trending downward for the past two weeks, with prices currently hovering around $60,000. Yesterday, we issued a buy signal for Bitcoin with a target of $70,000, anticipating that the current support level would hold. However, given Bitcoin’s recent sharp decline, maintaining a long position now carries significant risk, akin to catching a falling knife. Consequently, we are closely monitoring price movements for signs of a potential bottom formation. Following yesterday’s move above $60,000, we have shifted our focus to maintaining our long position at this level. It’s notable that the 200-day Simple Moving Average (SMA) in purple provided substantial support during Monday’s decline, helping Bitcoin to stabilize. However, the 20 SMA acted as resistance, pushing the price lower on Monday. Yesterday, the price dipped to $60,000 again, where it closed the day, with the 200 SMA acting as support.
BTC/USD – Daily chart
The 20 SMA Stops Ethereum From Reversing Higher
Ethereum (ETH) has experienced significant volatility since the launch of its ETF, reaching a peak of $3,832.50. This surge was driven by increased market confidence following the SEC’s favorable ruling on spot Ethereum ETFs. Ethereum’s value has surged by 25% from its previous high, indicating strong investor interest and market demand. However, Ethereum recently fell below the $3,500 mark. Last week, the 20-week Simple Moving Average (SMA) (gray line) acted as support, and this week we are observing a rebound from that MA. This could signal potential stabilization and renewed upward momentum for Ethereum in the short term, but ETH buyers must first overcome the 20 SMA (gray) for a sustained rally.
ETH/USD – Weekly chart
- Check out our free forex signals
- Follow the top economic events on FX Leaders economic calendar
- Trade better, discover more Forex Trading Strategies
- Open a FREE Trading Account
Related Articles
Comments
Sidebar rates
Related Posts
