


Forex Signals Brief July 1: Manufacturing and Services Data Today
Last week all the attention was on the PCE inflation report from the US, which left most assets trading in a tight range, while today we have several manufacturing and services report, which will show the shape of these sectors amid a high interest rate environment.

Last week, the CPI report from Canada showed a jump for April, which kept the CAD mostly bullish throughout the week. In the US, the New home sales and the Pending home sales missed expectations, showing another decline in May, which shows that the high rates by the FED are hurting the housing sector.
Friday marked the end of both the month and the second quarter, complicating the ability to draw definitive conclusions. The PCE data released early in the day showed a slight cooling of inflation, though it also indicated some wage pressures. Consequently, this did not trigger significant volatility in the markets.
This Week’s Market Expectations
The attention this week will be on the NFP (Non-Farm Payrolls) numbers on Friday, but we have some interesting events during the week as well. Here’s a rundown of key economic events scheduled for the coming week:
Monday:
- China: Caixin Manufacturing PMI
- Switzerland: Retail Sales
- US: ISM Manufacturing PMI
Tuesday:
- Australia: RBA Meeting Minutes
- Eurozone: CPI, Unemployment Rate
- US: Job Openings (JOLTS), Fed Chair Powell’s Speech
Wednesday:
- Australia: Retail Sales
- China: Caixin Services PMI
- Eurozone: PPI
- US: ADP Employment Report, Jobless Claims, ISM Services PMI, FOMC Meeting Minutes
Thursday:
- US: Independence Day Bank Holiday
- Switzerland: Unemployment Rate, CPI
- Eurozone: ECB Meeting Minutes
- UK: General Election
Friday:
- Eurozone: Retail Sales
- Canada: Labour Market Report
- US: Non-Farm Payrolls (NFP)
Last week the volatility was low as traders were waiting for the US PCE report to be released on Friday, which came as expected and didn’t move the USD too much. Most assets traded in a range, so we kept playing it, selling at the top and buying at the bottom, which resulted to be a good trading strategy. We opened 25 trading signals and ended up with 17 winning forex signals and 8 losing ones, giving us a good win/loss ratio.
MAs Turning Into Resistance for Gold Now
In recent months, gold has consistently formed lower highs, with MAs acting as resistance. This suggests a potential trend reversal, but the support has to go first. On Thursday, gold prices saw a slight recovery as the US dollar weakened, but they lagged behind other assets like foreign currencies, which made significant gains against the dollar, as investors braced for the anticipated release of strong US PCE inflation data. But that came as expected which left Gold unchanged at the end of the day.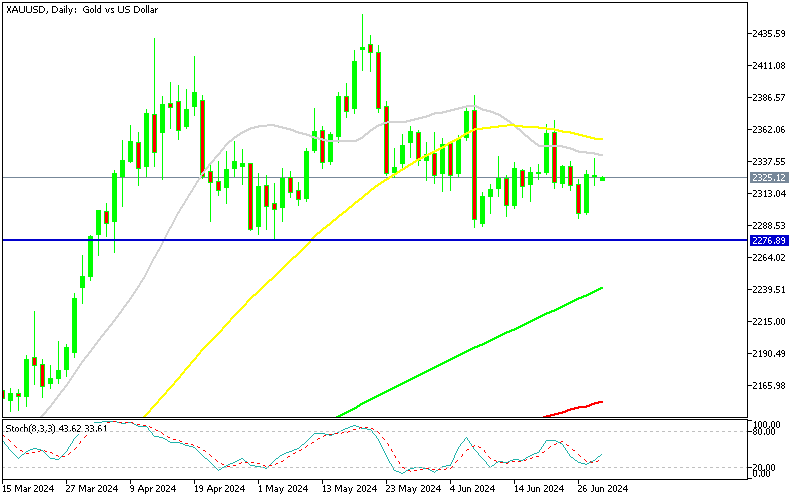
XAU/USD – Daily chart
USD/JPY Stabilizes Above 160
USD/JPY has successfully surpassed the key 160.00 level, continuing its upward momentum as the absence of intervention from Japanese authorities has bolstered market confidence in reaching new highs. Last week, the pair dipped to the 160.00 level but quickly rebounded as buyers re-entered around the 160.20s, aiming for new highs with stops positioned below this critical support. On the 4-hour chart, a minor trendline has recently formed, marked by the 20 SMA (gray), signaling strong buying pressure. Buyers will depend on the 20 SMA to sustain the upward momentum towards new highs, while sellers will need the price to fall below both the trendline and the 160.00 level to start targeting new lows.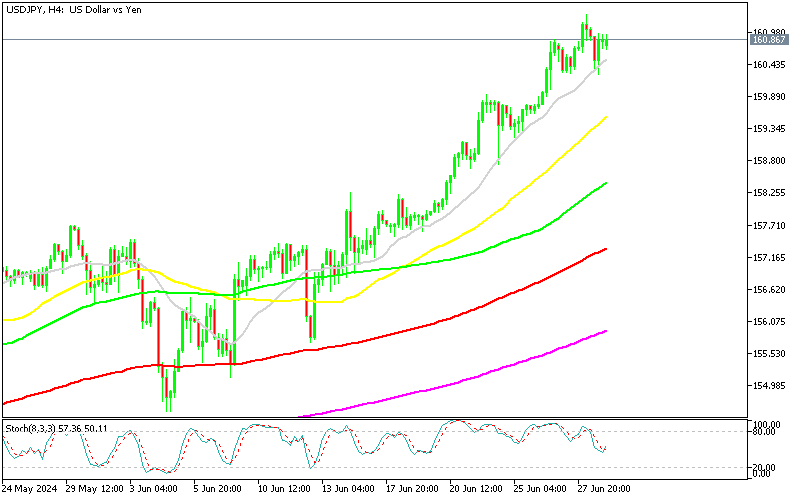
USD/JPY – Daily Chart
Cryptocurrency Update
Bitcoin Starts the Reversal Higher
Bitcoin has been experiencing a downward trend for the past two weeks, with the price recently hovering around $60,000. Yesterday, we issued a buy signal for Bitcoin, targeting $70,000, confident that the current support zone would hold. However, given Bitcoin’s recent rapid decline, entering a long position now carries high risk, akin to trying to catch a falling knife. Consequently, we are closely monitoring price movements for signs of a potential bottom formation. After yesterday’s breakout of the $60,000 barrier, we have shifted our focus to our long position at this level. It’s worth noting that the 200-day Simple Moving Average (SMA) in purple provided strong support during Monday’s decline, helping BTC stabilize.
BTC/USD – Daily chart
Ethereum Finds Support at MAs
Ethereum (ETH) has experienced significant volatility since the introduction of its ETF, reaching a peak of $3,832.50. This surge was driven by heightened market confidence following a positive SEC ruling on spot Ethereum ETFs. Ethereum’s value increased by 25% from previous highs, demonstrating robust investor interest and market demand. However, Ethereum has recently dipped below $3,500. Over the weekend, the 50-day Simple Moving Average (yellow line), which had previously acted as a support level, showed signs of weakness. Last week, intensified selling pressure pushed the price below the 100-day SMA (green line), but it found support there.
ETH/USD – Daily chart


Sidebar rates
Related Posts
Add 3440

